
3Q25 Presentation
October 14, 2025
© 2025 Wells Fargo Bank, N.A. All rights reserved.
Firm Update
© 2025 Wells Fargo Bank, N.A. All rights reserved.
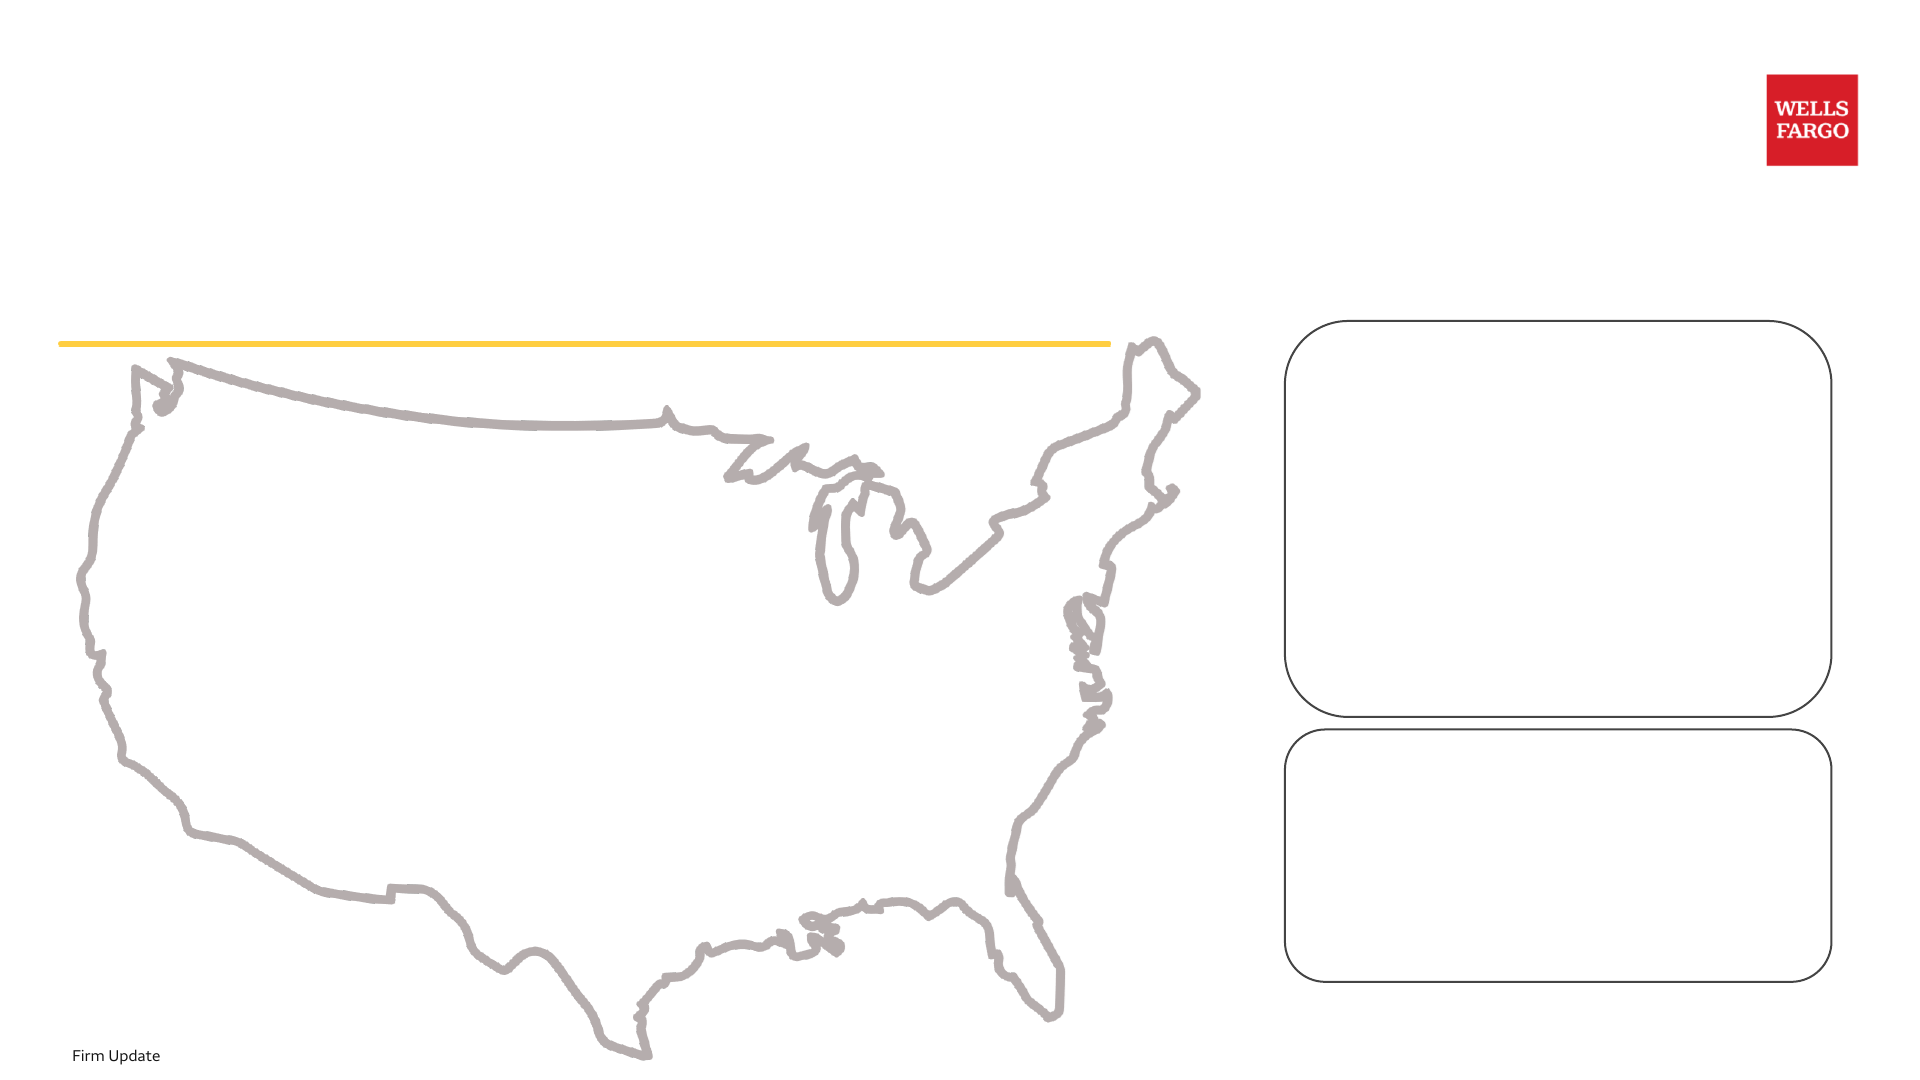
Wells Fargo is a U.S. focused bank and benefits from the strength of the U.S. economy
U.S. continues to be the most attractive market
| 지표 | 수치 |
|---|---|
| GDP¹ | ~$30T |
| Real GDP growth¹ | 2.7% |
| Market Capitalization² | ~$67T |
| Applications for New Business Formations¹ | 5.2mm |
U.S. focused with select international capabilities
Well positioned to serve U.S. companies operating globally and global companies operating in the U.S.
>95% Revenue is U.S.-Based (2024)
Wells Fargo does well when the U.S. economy does well and our stable legal and regulatory system supports well functioning banking and capital markets
Endnotes are presented starting on page 28.
Scale matters and we have it in all of our businesses
2024
| 사업부 | Revenue | Average Loans | Average Deposits | Select Metrics |
|---|---|---|---|---|
| Consumer Banking and Lending (CBL)¹ | $36B | $325B | $775B | #3 Deposit Share / 4,108 Branches (#2 Rank) / >32MM Mobile Active Customers / ~$50B Credit Card Loans |
| Wealth and Investment Management (WIM)² | $15B | $83B | $108B | >$2T Client Assets, Including ~$1T Advisory Assets / #3 Financial Advisors Among Large Bank Peers / #4 Wealth Client Assets |
| Corporate and Investment Banking (CIB)³ | $19B | $277B | $193B | #2 U.S. C&I Loans / #6 U.S. Investment Banking Market Share / Relationships with >90% of S&P 500 / #2 Bank CRE Loan Portfolio |
| Commercial Banking (CB)⁴ | $13B | $223B | $172B | ~1 in 5 Middle Market Companies Banked / 20 years Average Client Relationship Tenure / #1 Left Lead Arranger for Middle Market / Leveraged Loans |
Endnotes are presented starting on page 28.
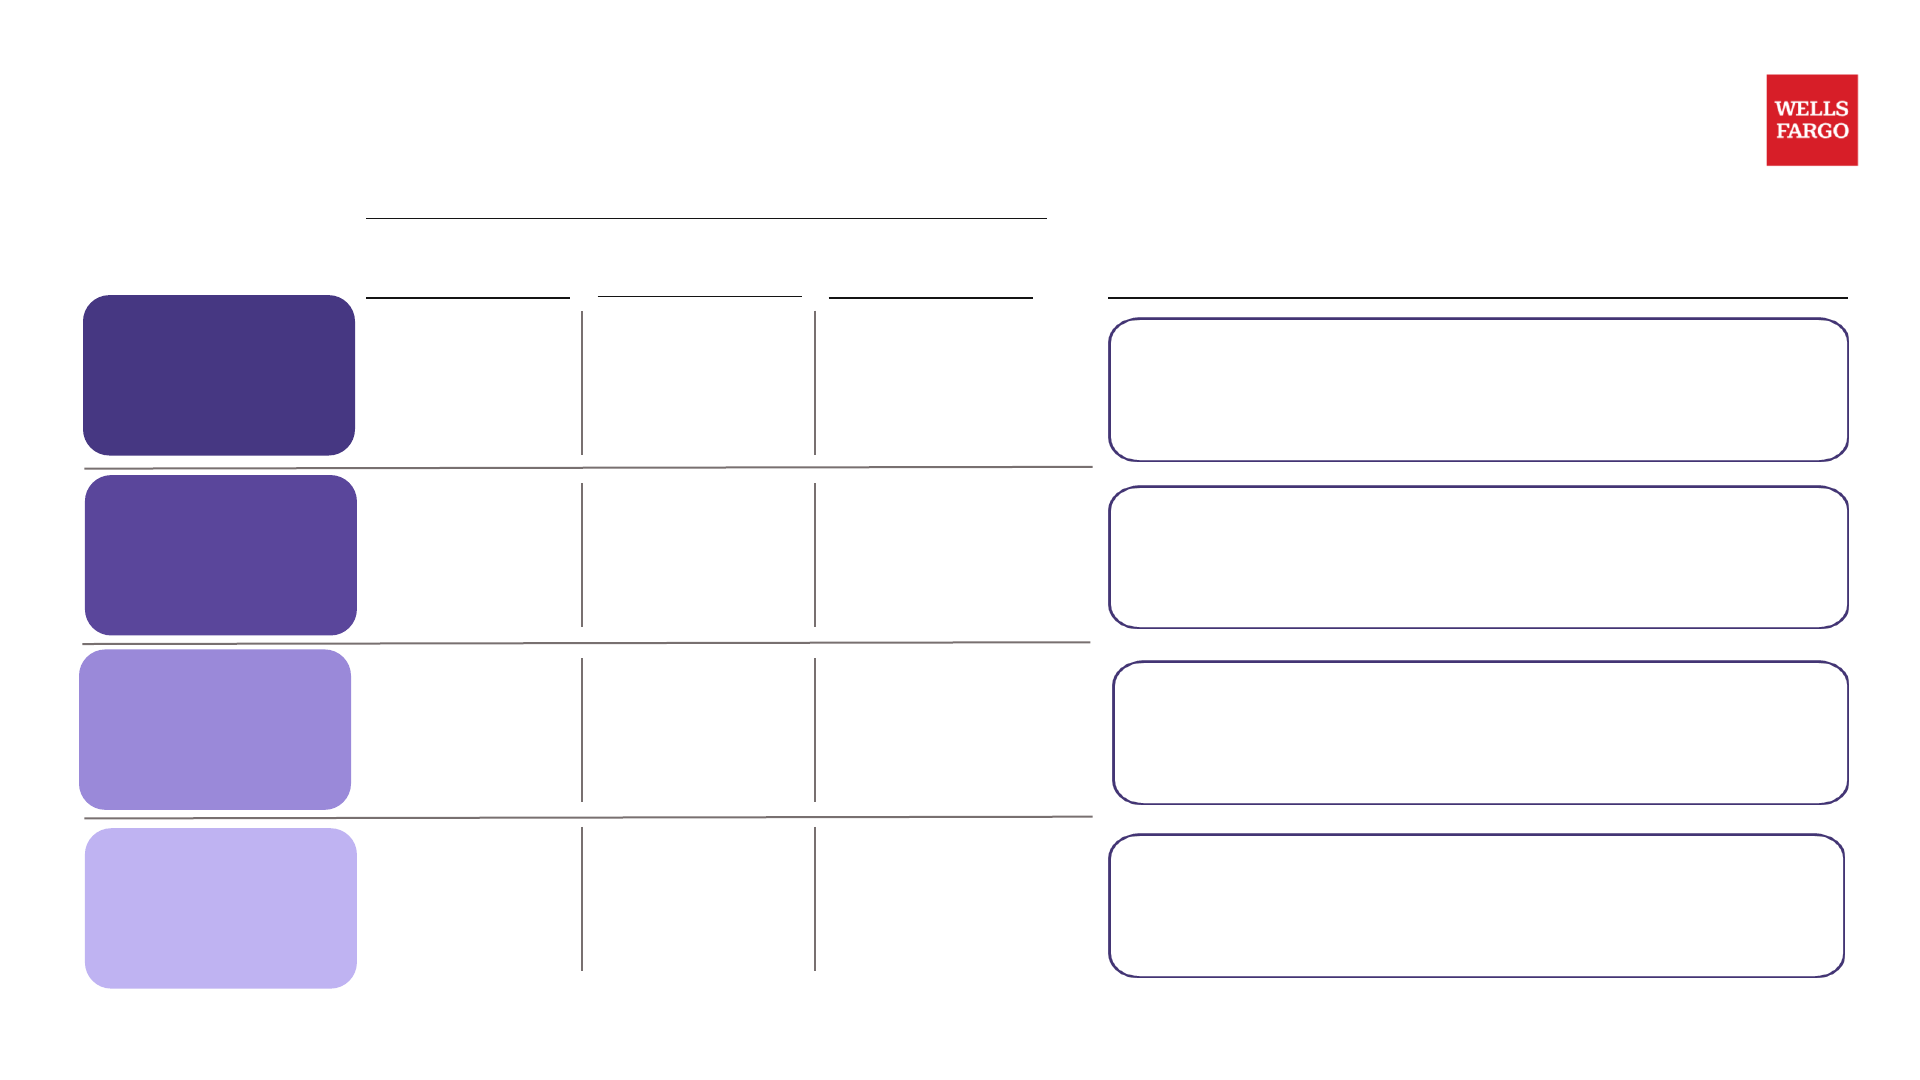
We simplified our businesses to better serve our customers and improve our earnings profile
Business Sales, Exits and Reductions
- Sold (2019-2025)
- Institutional Retirement & Trust
- Real estate investment banking business
- Asset Management
- Corporate Trust Services
- Canadian Direct Equipment Finance
- Student Lending portfolio
- Norwest Equity Partners and Mezzanine Partners funds
- Non-agency commercial mortgage servicing
- Announced sale of rail car leasing business
- Exited direct auto lending and international wealth management
- Simplification of Home Lending including exiting correspondent channel
Key Investments
| 사업부 | 투자 내용 |
|---|---|
| CBL | Investments in bankers and marketing, expanded Credit Card offerings, refurbishment of branch network, and new mobile app |
| WIM | Investments in advisors and the advisor experience, banking and investment products, and technology |
| CIB | Investments in talent and technology across Markets, Investment Banking, and Global Payments and Liquidity |
| CB | Investments in lending systems, digital client experiences, and payment infrastructure; expanded talent across key markets and industries |
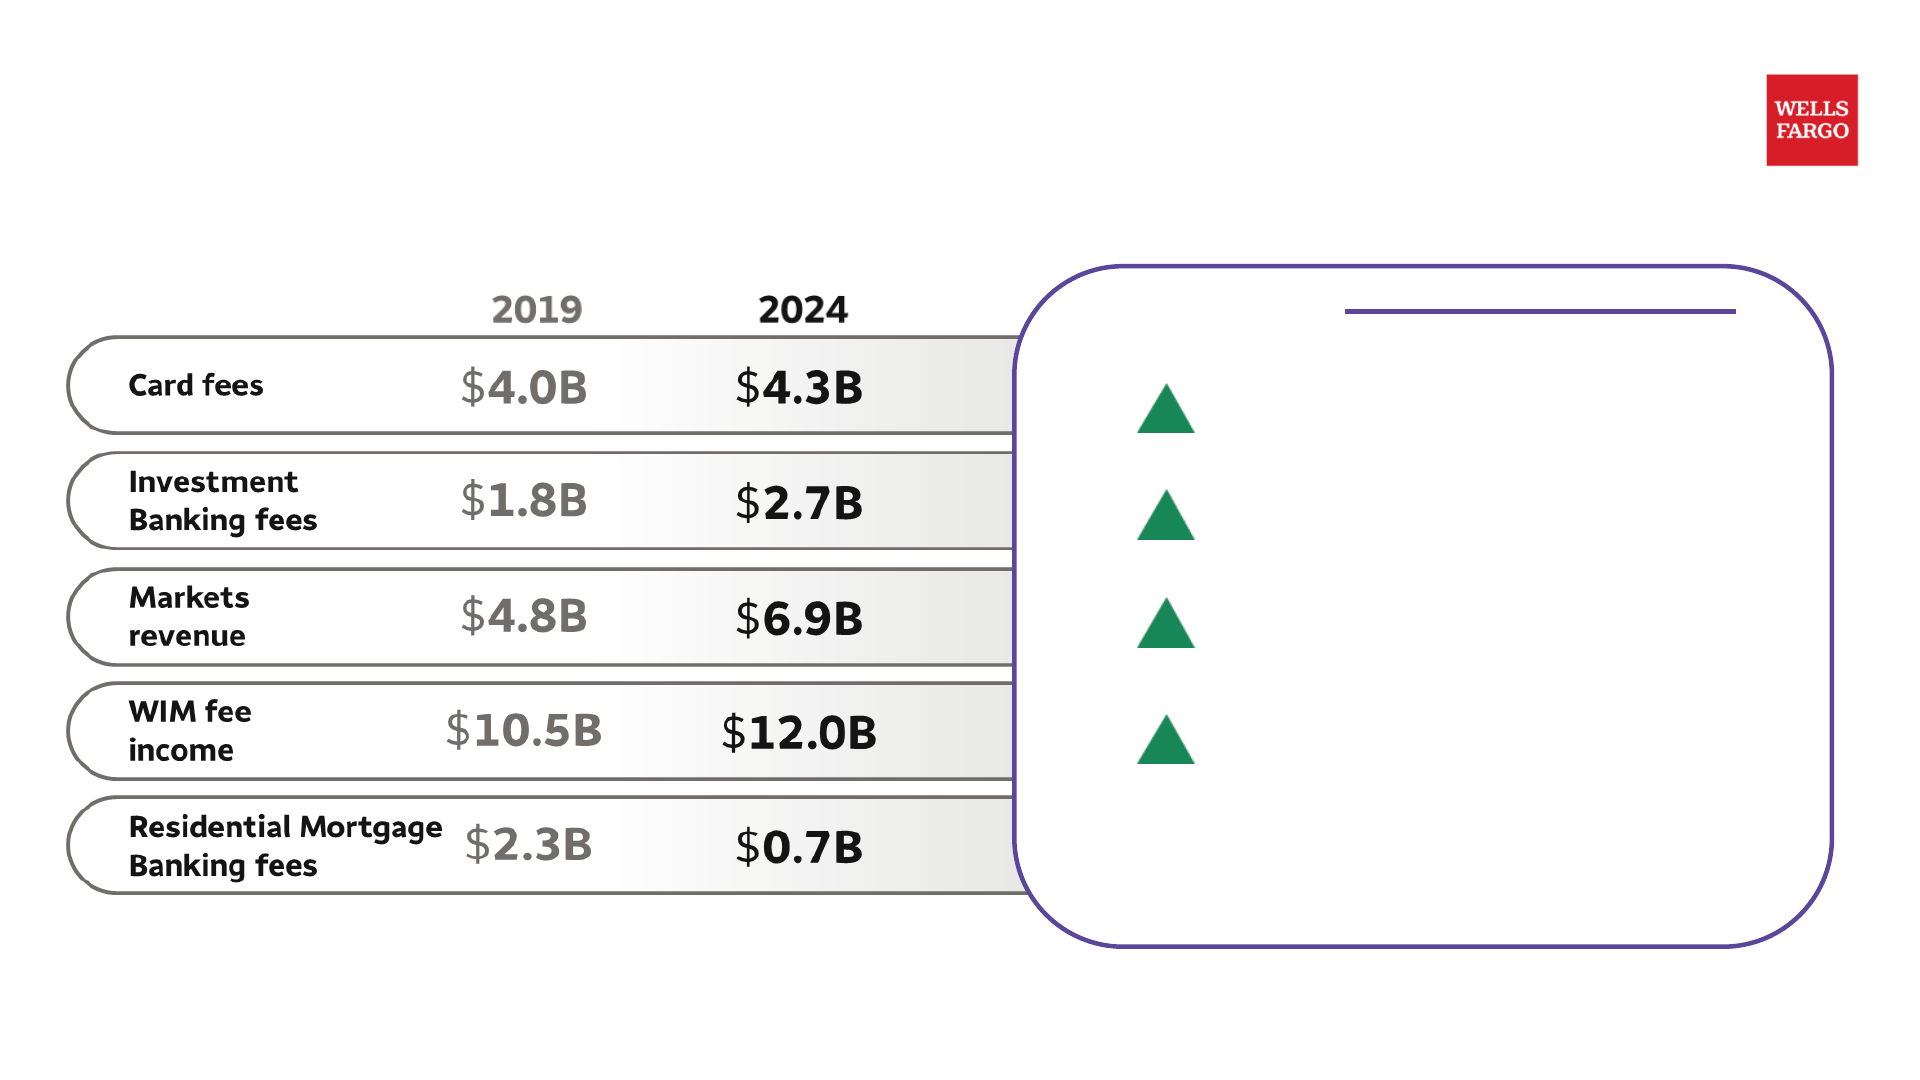
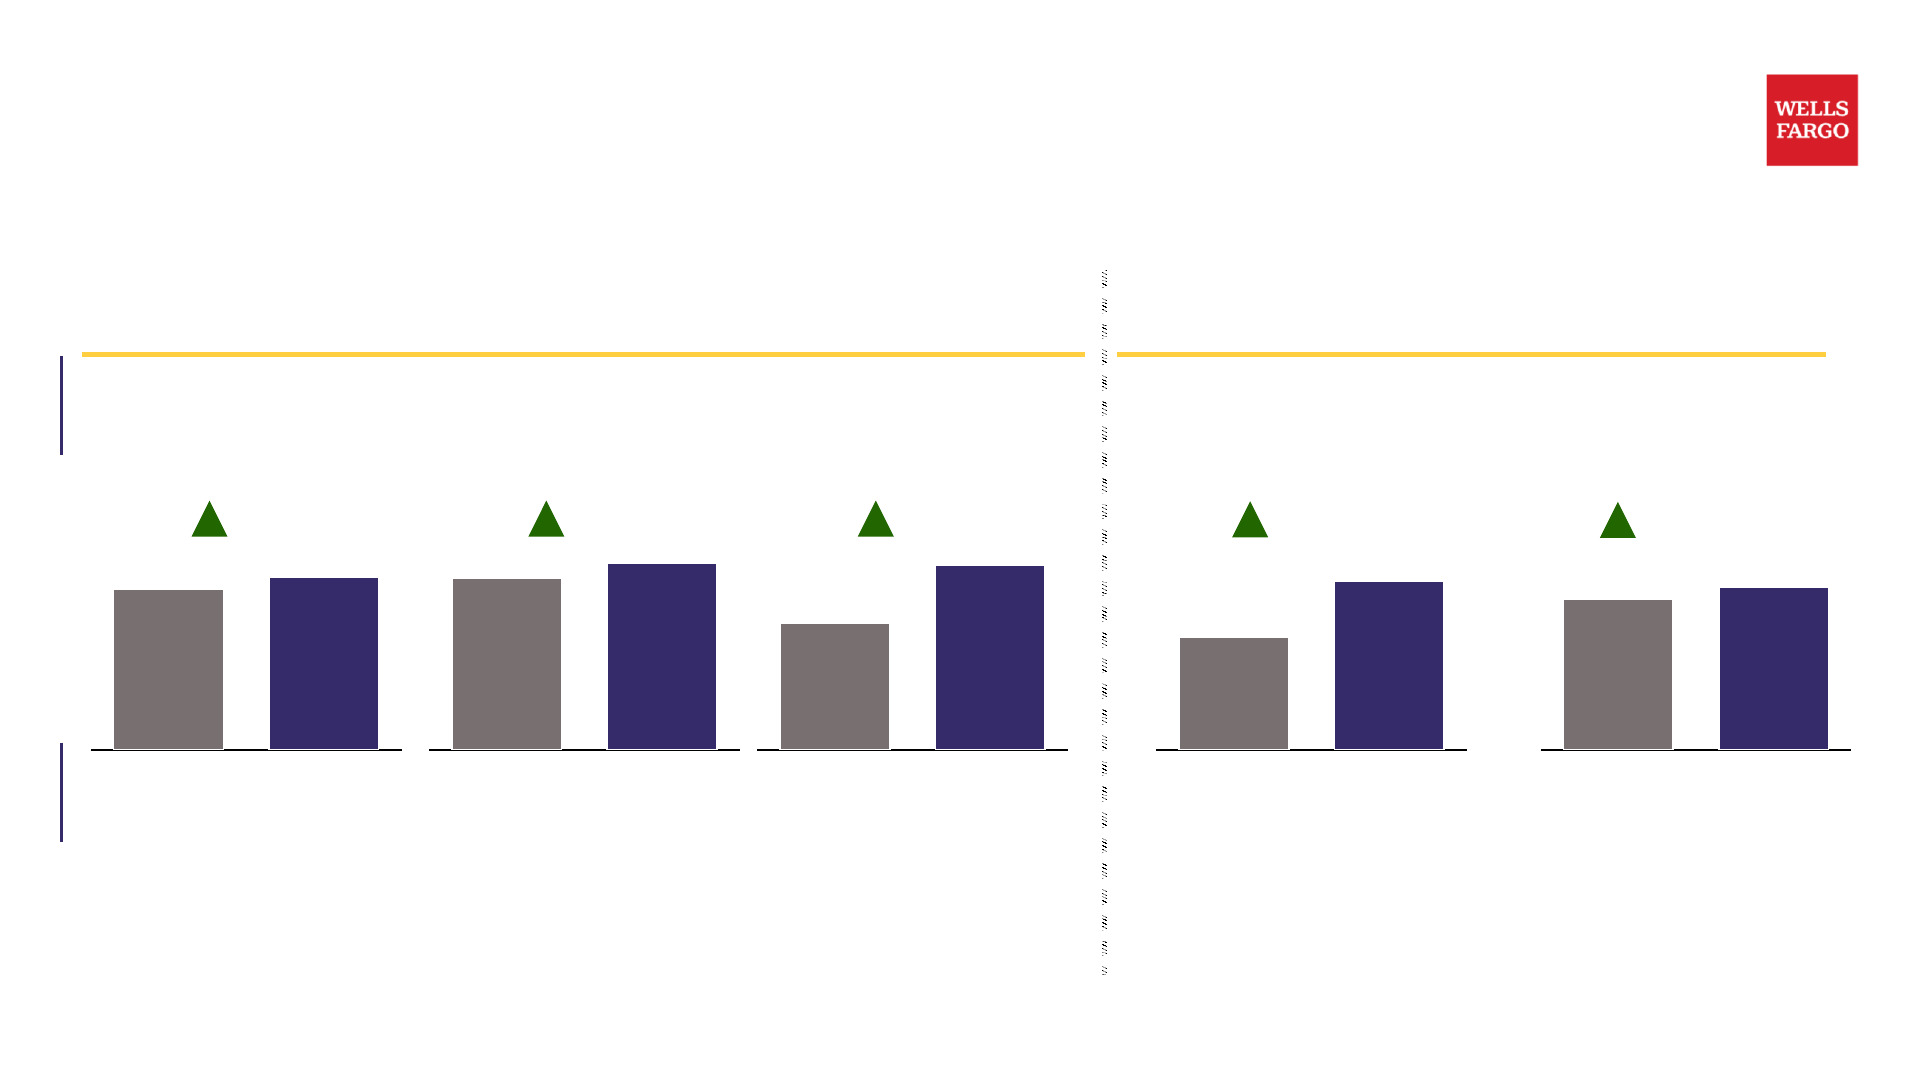
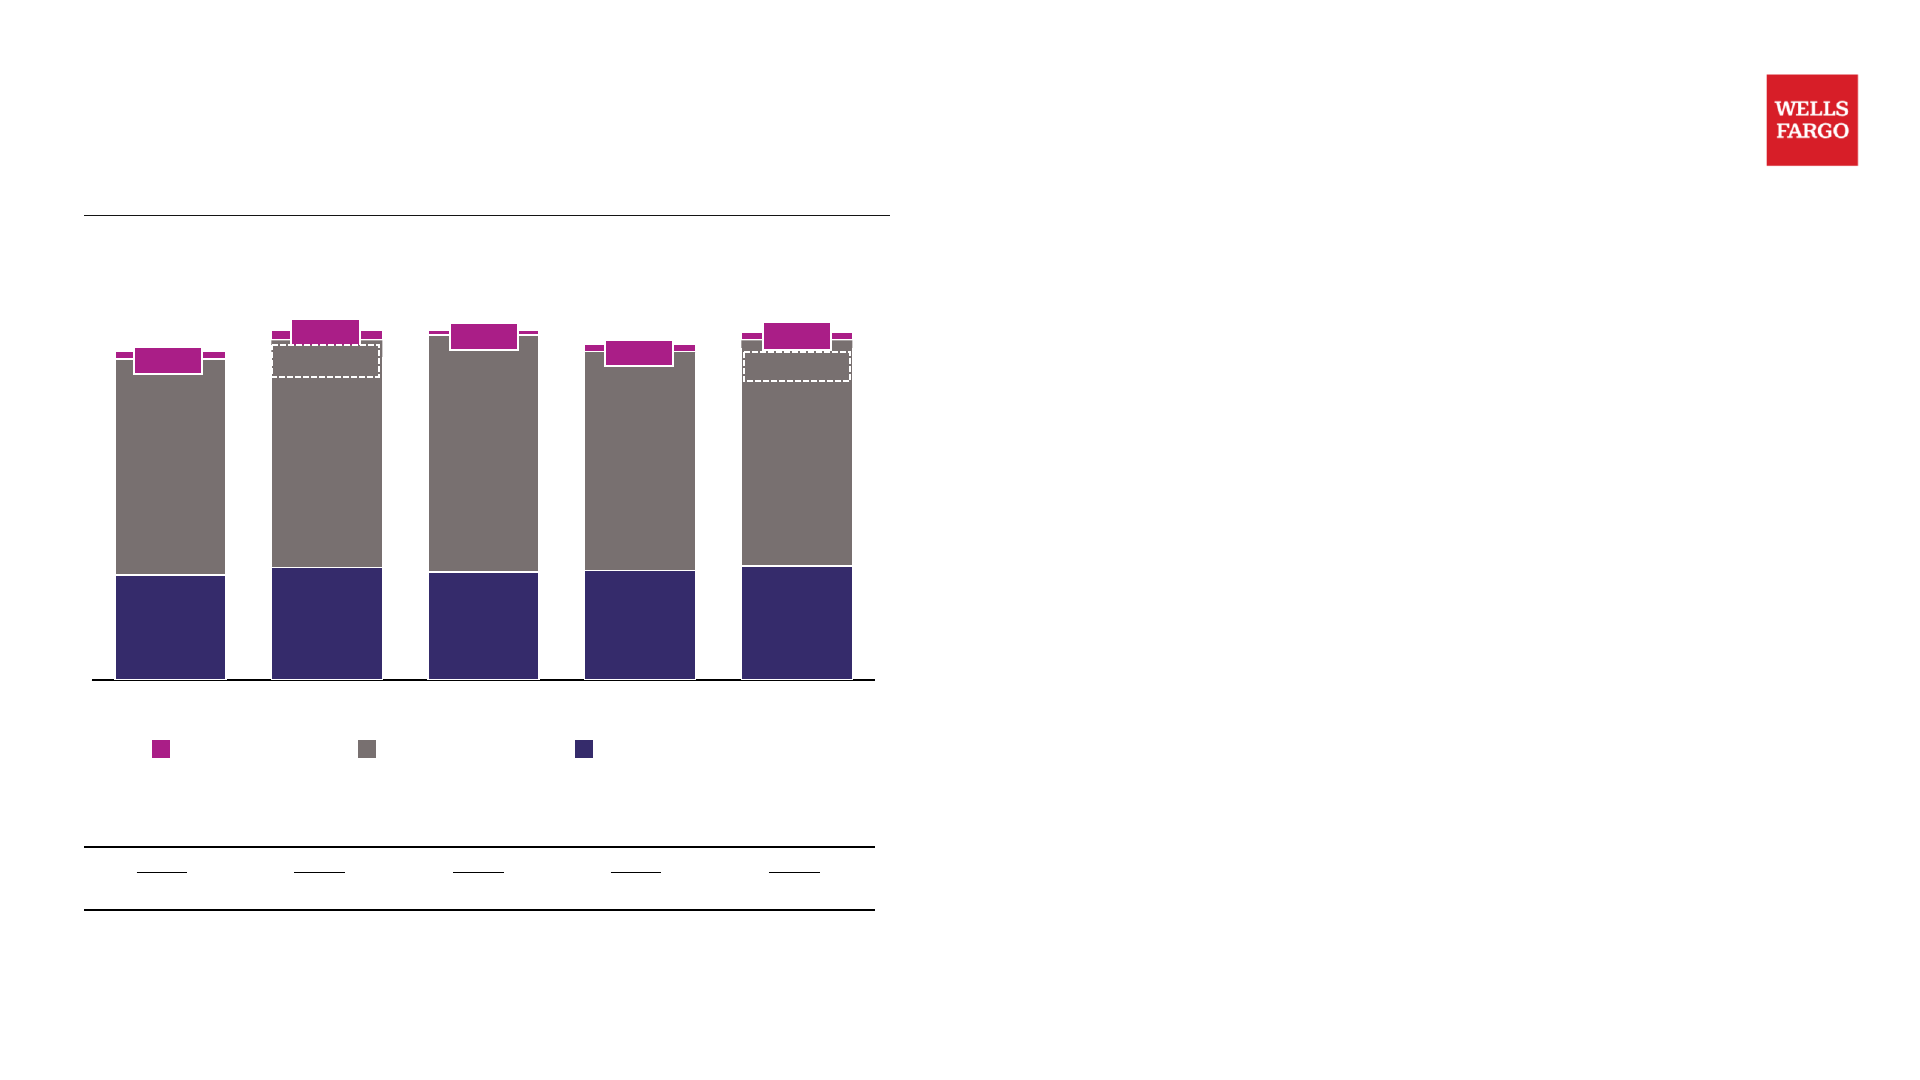
We have made progress diversifying our revenue mix and growing fee income streams
| 항목 | 2019 | 2024 | 2025 YTD |
|---|---|---|---|
| Card fees | $4.0B | $4.3B | ▲ 6% – 11 card launches since 2021 |
| Investment Banking fees | $1.8B | $2.7B | ▲ 19% – Invested in senior talent |
| Markets revenue | $4.8B | $6.9B | ▲ 2% – Improved capabilities and infrastructure |
| WIM fee income | $10.5B | $12.0B | ▲ 5% – Reduced attrition through improved offerings and advisor experience |
| Residential Mortgage Banking fees | $2.3B | $0.7B | Mortgage business focused primarily on existing banking and wealth management customers |
2025 YTD through September 30, 2025.
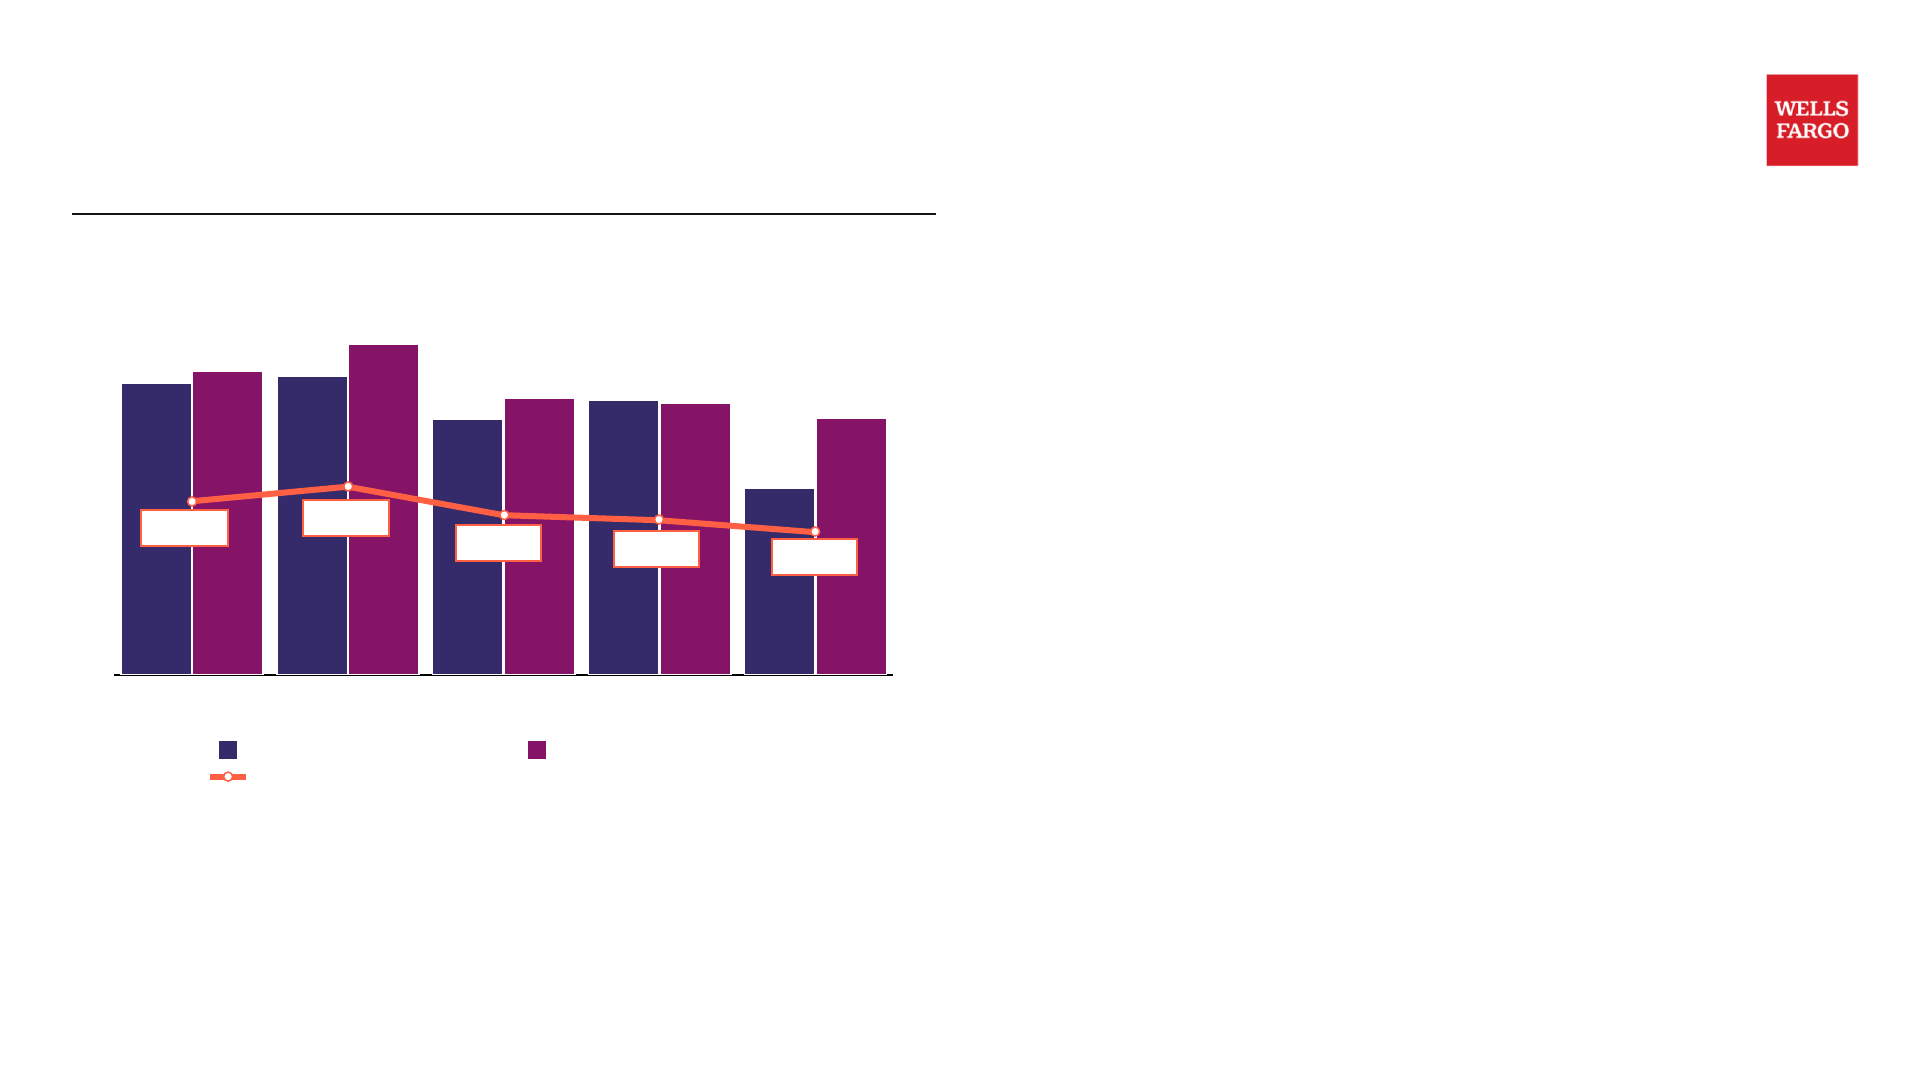
We have made significant progress on reducing expenses
Noninterest Expense ($B) ▼ (6%)
| 연도 | 금액 |
|---|---|
| 2019 | $58.2B |
| 2024 | $54.6B |
Headcount (000's) ▼ (~24%)
| 시점 | 인원 |
|---|---|
| 2Q20 | 276K |
| 3Q25 | 211K |
Professional and Outside Services Expense ($B) ▼ (31%)
| 연도 | 금액 |
|---|---|
| 2019 | $6.7B |
| 2024 | $4.6B |
Gross Expense Saves ($B) ~$15B (2021 – Full Year 2025E)
| 연도 | 절감액 |
|---|---|
| 2021 | $4.2B |
| 2022 | $3.3B |
| 2023 | $2.4B |
| 2024 | $2.4B |
| 2025E | ~$2.4B |
Non-Branch Real Estate ▼ (26%) Square feet (2019–2Q25)
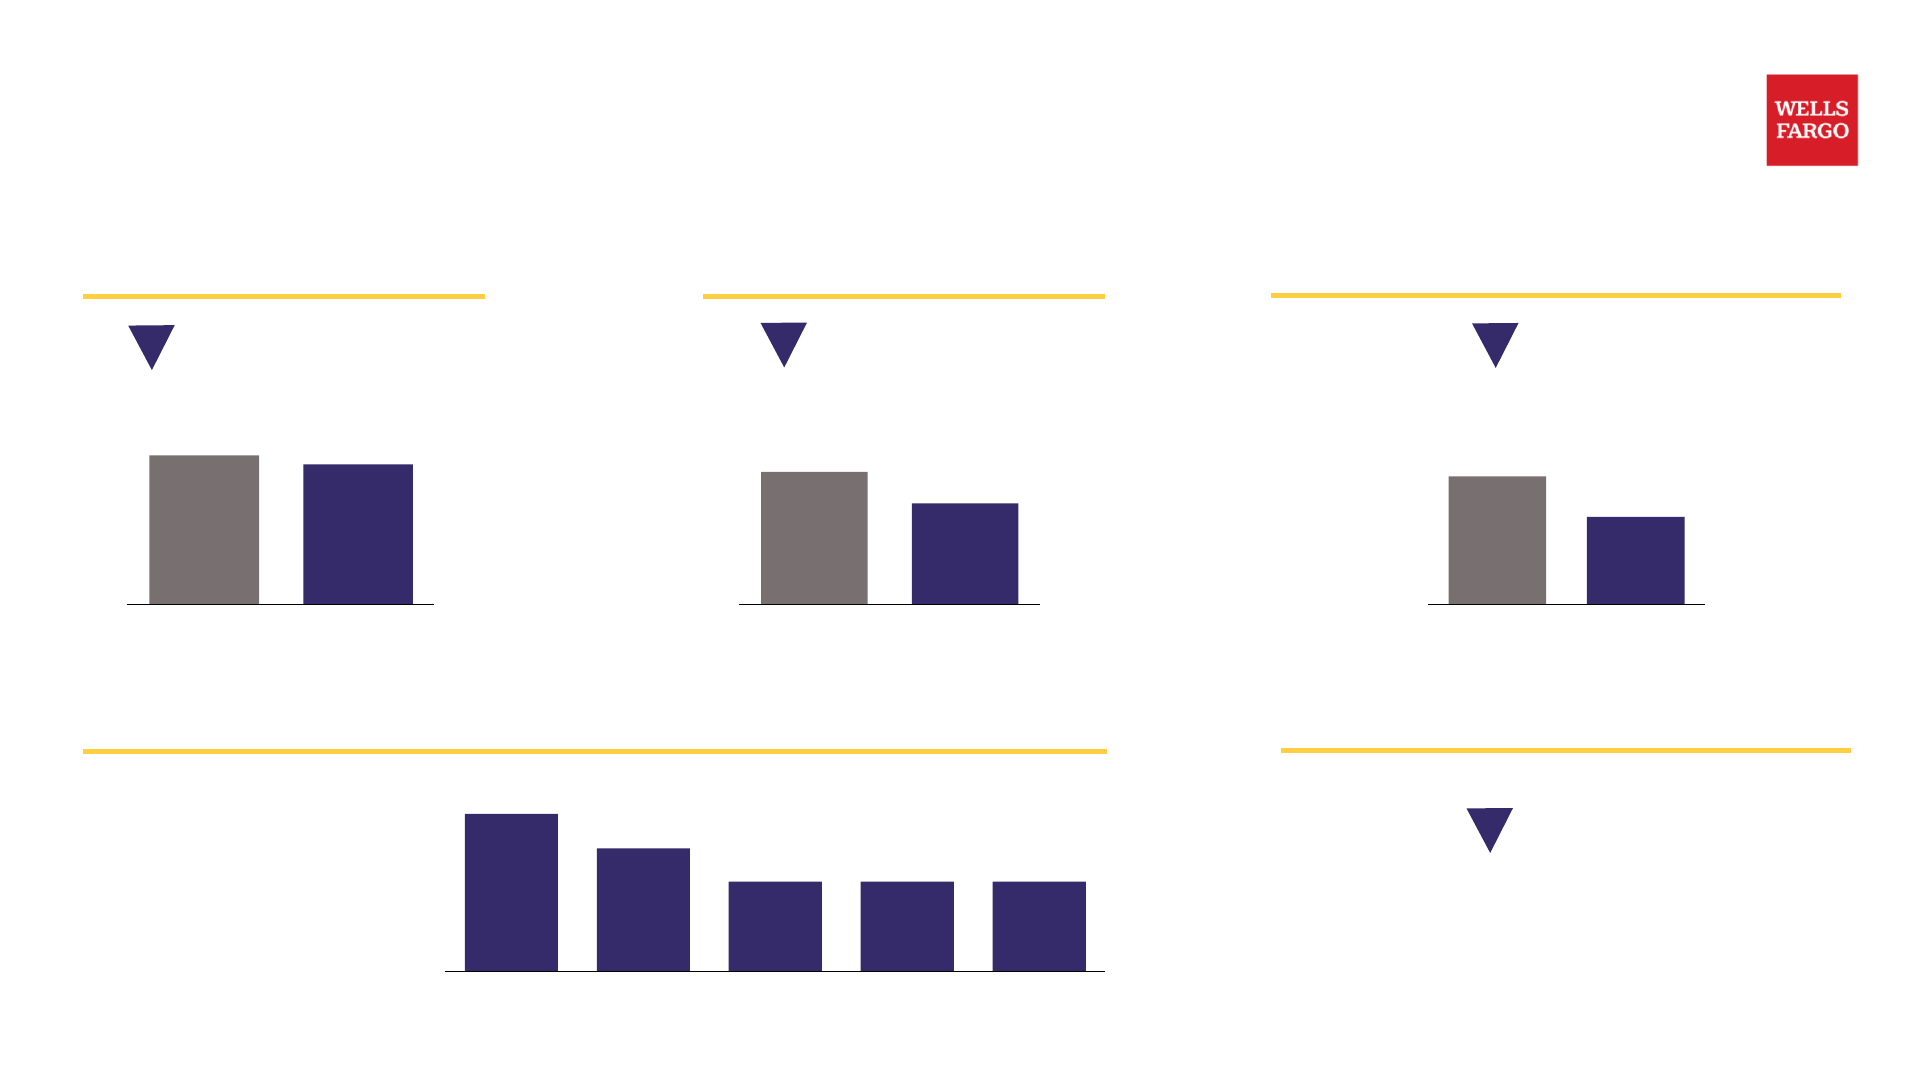
We have made progress improving returns, with a goal to achieve best in class returns for each segment over time
Return on Tangible Common Equity (ROTCE)¹ Progress
| 시점 | ROTCE |
|---|---|
| 4Q20 | 8% |
| 2025 YTD | 15% |
Return on Equity (ROE) of 7% for 4Q20 and 12% for 2025 YTD.
각 사업부(CBL, WIM, CB, CIB)는 2024 실적 대비 Best in Class² 수준 달성을 목표로 하고 있음.
Endnotes are presented starting on page 28.
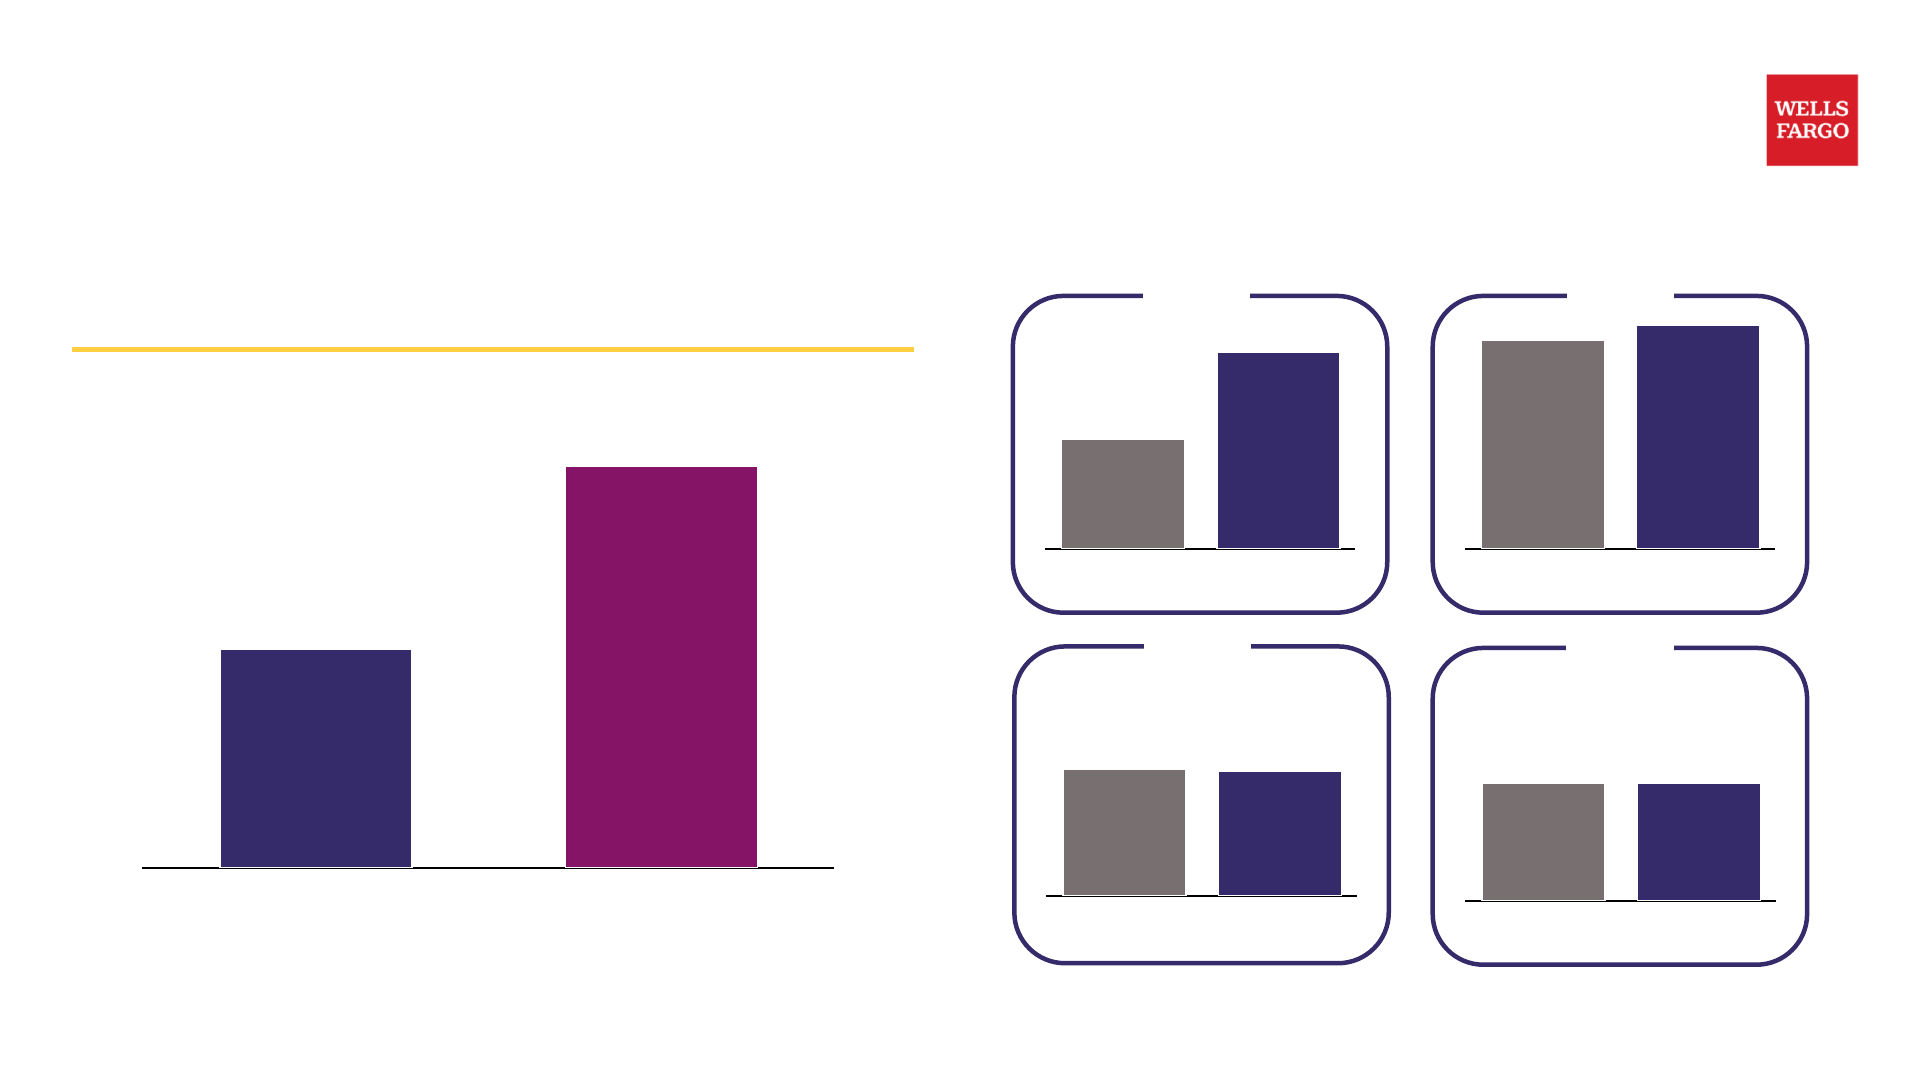
Removal of asset cap provides additional opportunities for growth
Consumer Banking and Lending & Wealth and Investment Management
Recent Progress:
| 지표 | 2024 → 2025 | 변화율 |
|---|---|---|
| YTD Checking Account Opens | — | ▲ 8% |
| YTD Credit Card New Accounts | — | ▲ 9% |
| YTD Net Investment Flows in WF Premier | — | ▲ 47% |
Integrated businesses with breadth, scale, and nationwide physical and digital presence with the opportunity to accelerate growth
Commercial Banking & Corporate and Investment Banking
| 지표 | 수치 | 변화율 |
|---|---|---|
| Trading-Related Assets ($B) | 4Q23: 204 → 3Q25: 306 | ▲ 50% |
| U.S. Investment Banking Share¹ | FY 2024: 4.1% → YTD 2025: 4.4% | ▲ 30 bps |
Investments in talent and technology while leveraging relationships and deploying capital strategically
Endnotes are presented starting on page 28.
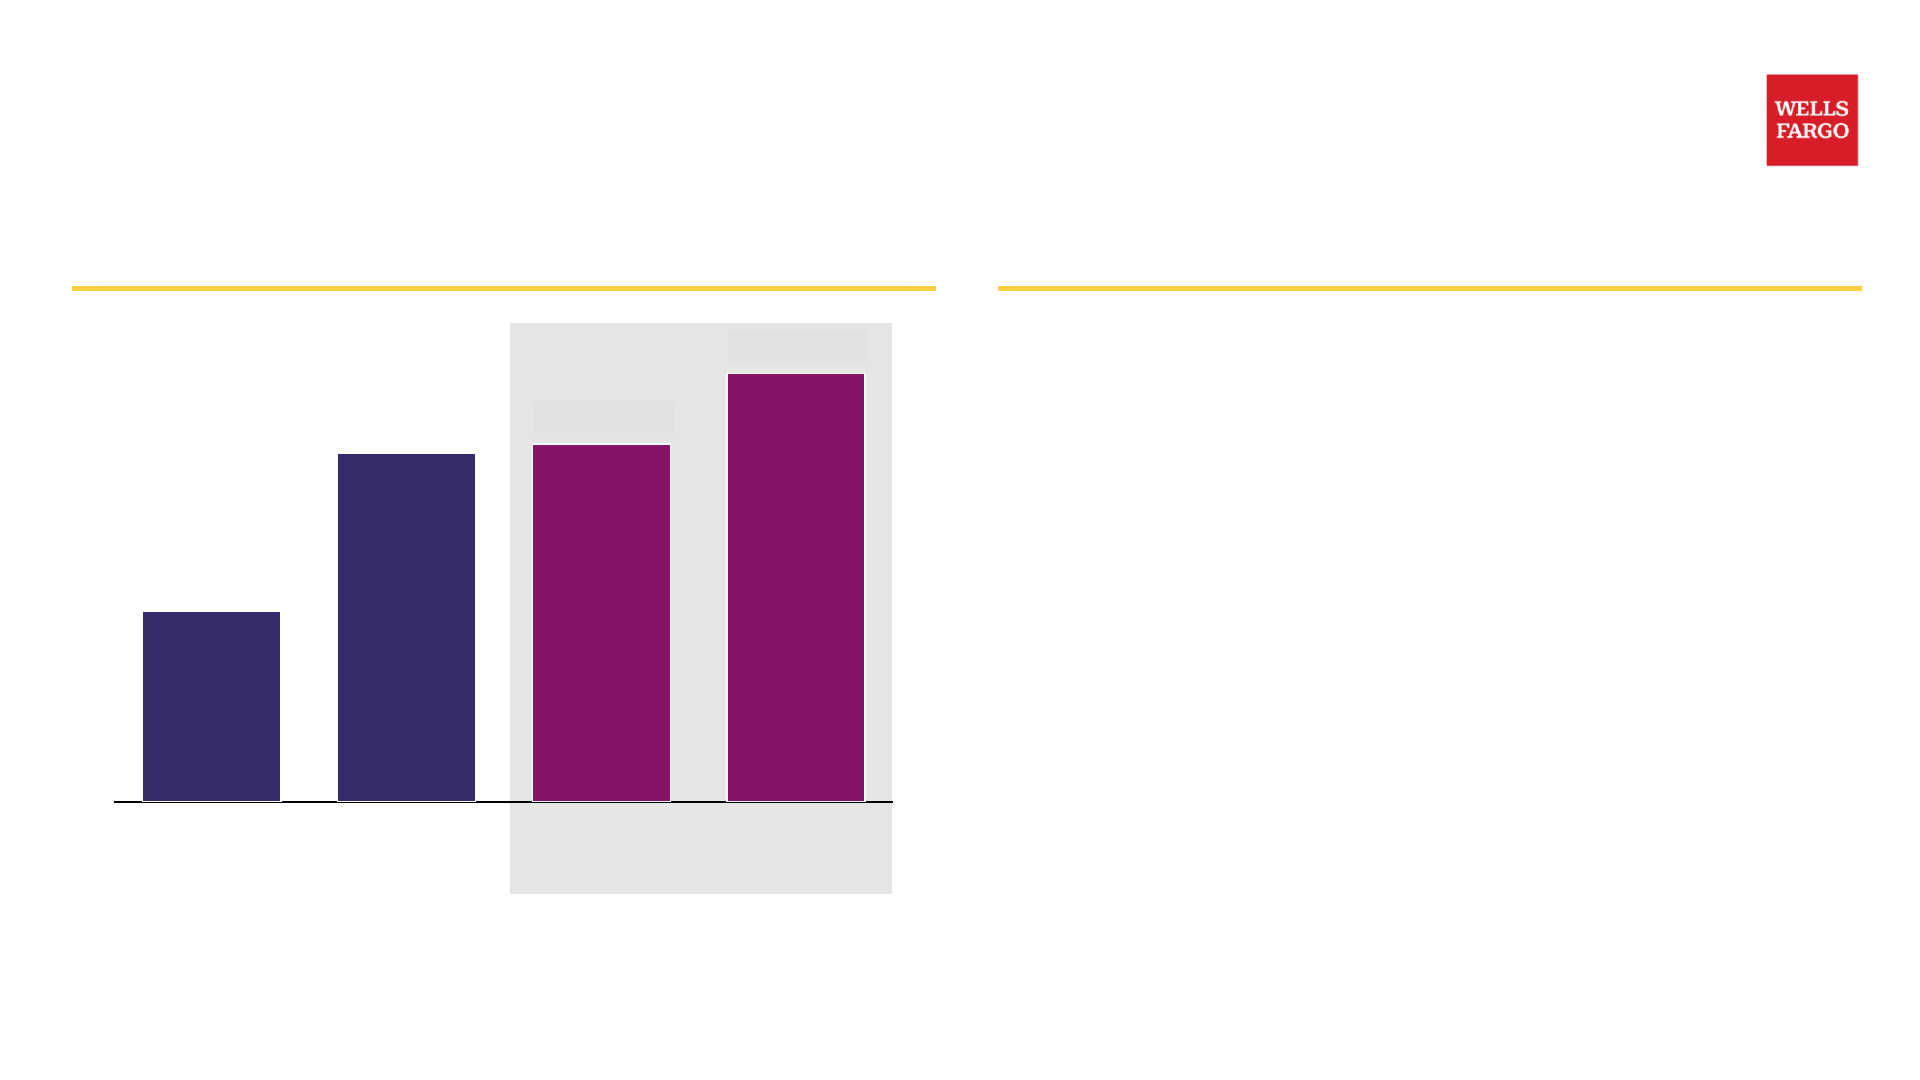
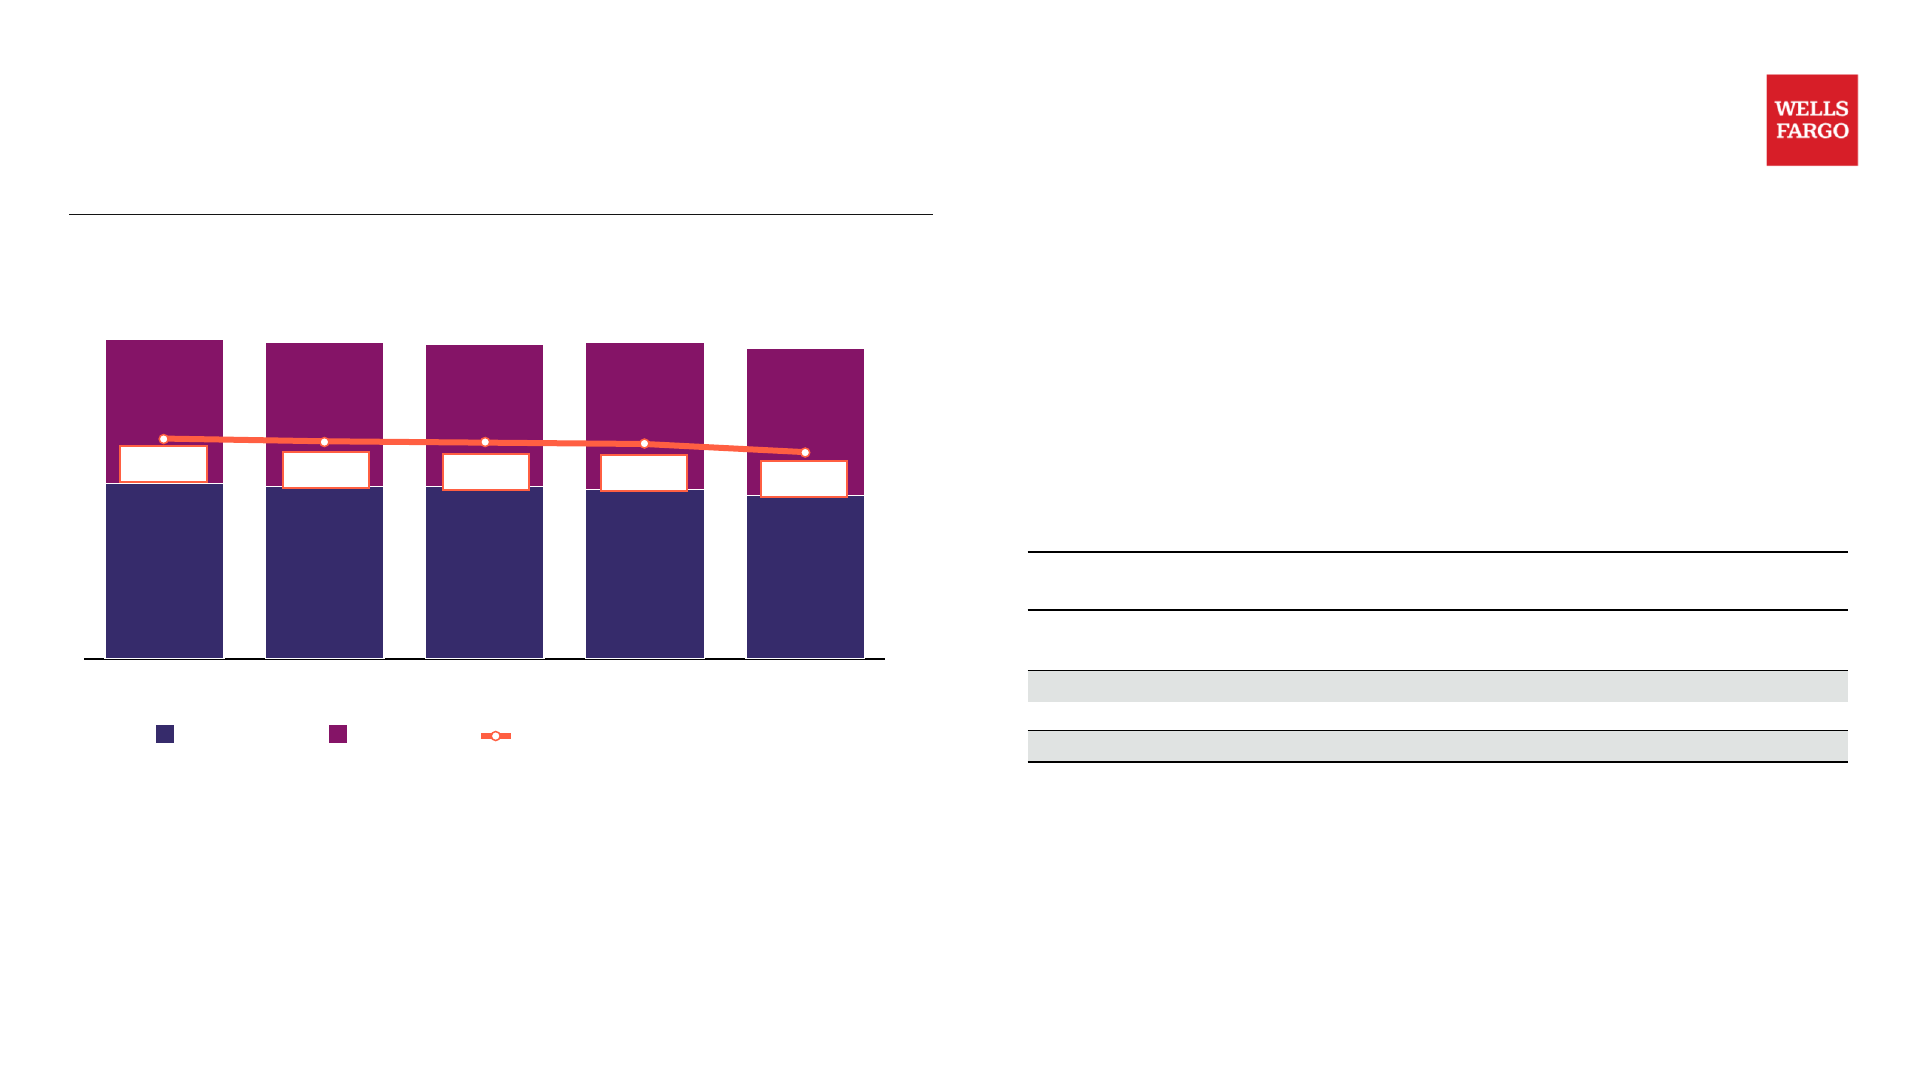
We are now targeting a 17-18% ROTCE; managing CET1 ratio down to 10-10.5%
ROTCE¹ Progress on Higher Returns
| 시점/구분 | ROTCE |
|---|---|
| 4Q20 | 8% |
| 2025 YTD | 15% |
| Prior Target | 15% |
| New Medium-term Target | 17 – 18% |
Progress on Higher Returns
- In 4Q20 we laid out a path to generate higher returns and have made significant progress on this goal
- We believe we have additional opportunities to improve our returns and are targeting an ROTCE of 17 – 18% over the medium-term, driven by:
- Realizing returns on our investments and capitalizing on revenue growth opportunities across the company
- Incremental efficiencies across all our businesses and functions
- Completing the transformation and simplification of our Home Lending business
- Improving profitability across our operating segments
- Optimizing capital
- Managing our CET1 ratio² down to 10 – 10.5% after having been at or above 11% in each of the last nine quarters
- ROTCE performance and capital levels will ultimately be determined by a variety factors including macroeconomic factors such as interest rates, as well as the evolving regulatory landscape
ROE of 7% for 4Q20 and 12% for 2025 YTD. Endnotes are presented starting on page 28.
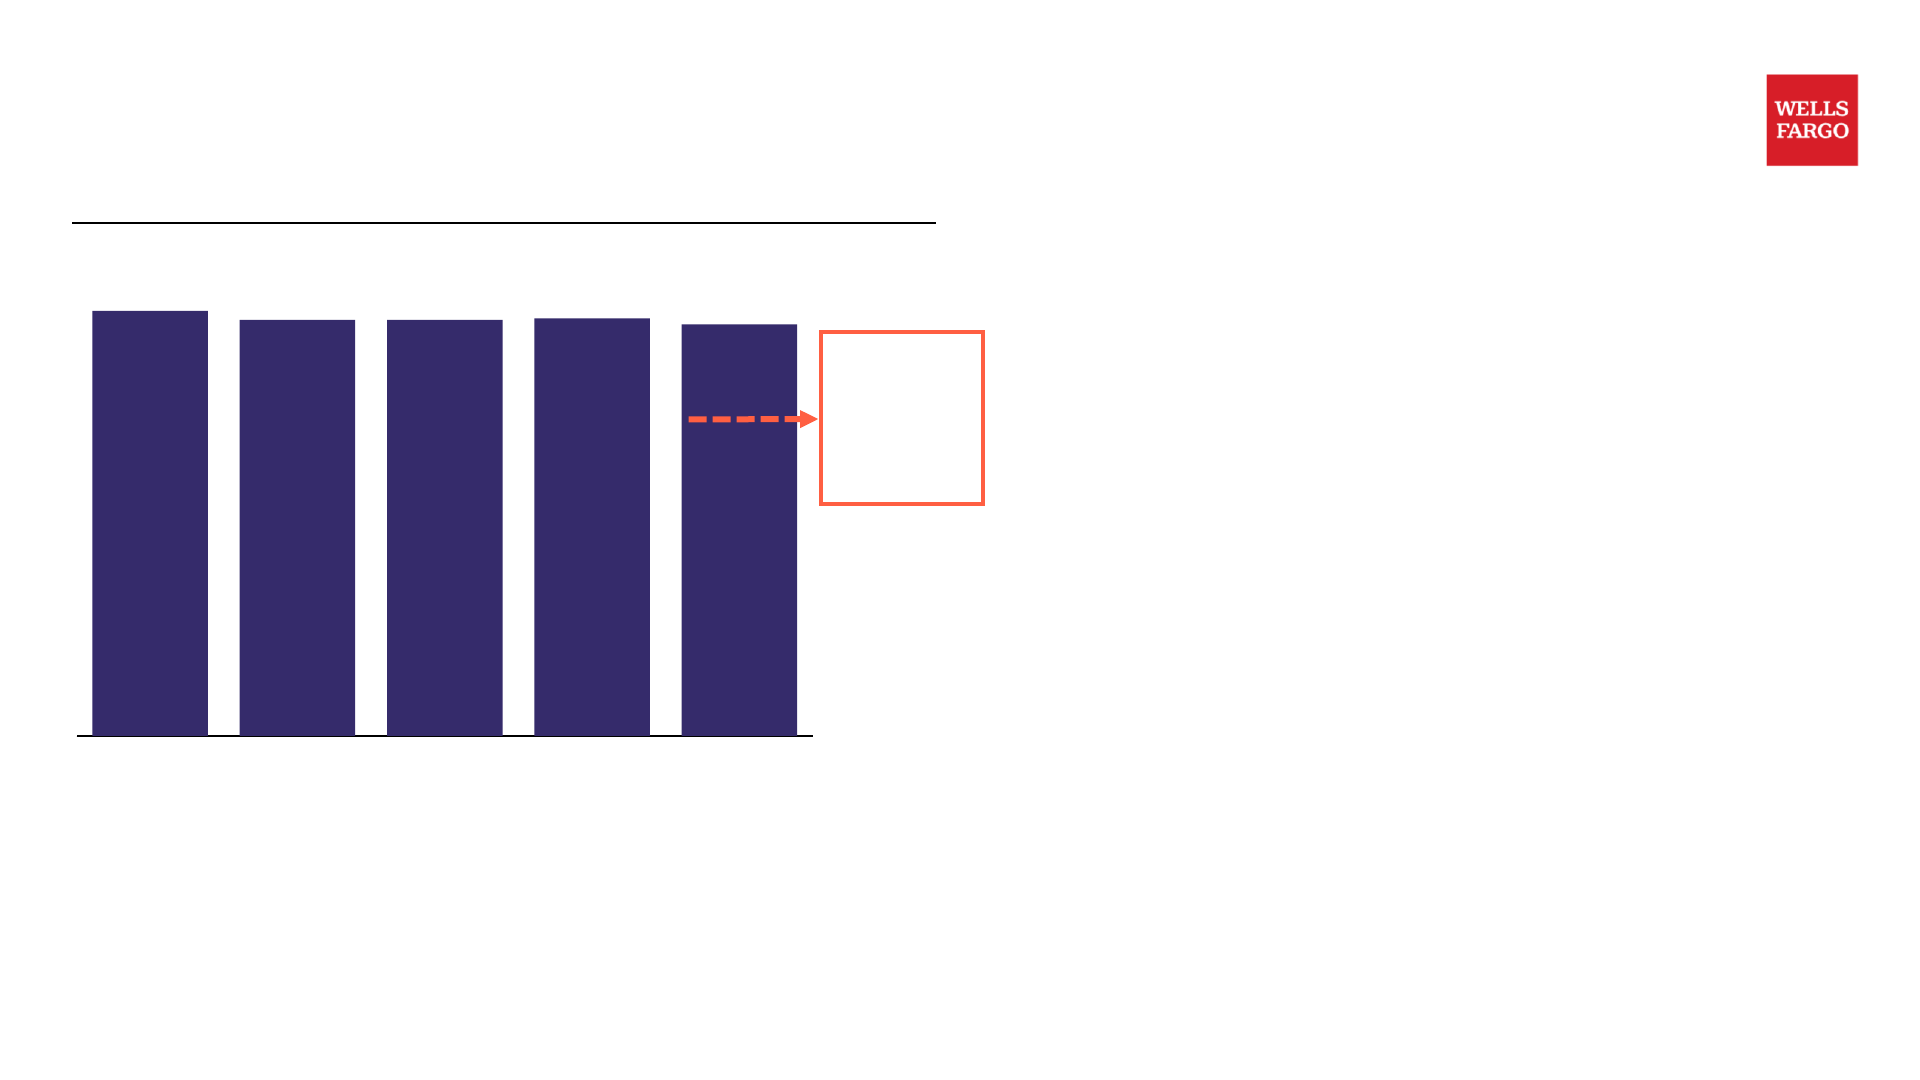
We are a different company today than we were five years ago and have significant opportunities ahead
Substantial progress since 2019...
| 영역 | 수치 | 달성 내용 |
|---|---|---|
| Risk and Control | 13 Consent orders terminated | ✓ Built appropriate risk and control framework |
| Simplified Business | 12 Businesses sold or exited | ✓ Simplified businesses to focus on core franchise |
| Efficiency Saves | ~$15B Gross expense saves (2021 – full year 2025E) | ✓ Reduced expenses on significant efficiency agenda |
| Investment | People/Technology/New Products | ✓ Invested to improve capabilities and product offerings |
| Capital Return | 24% Reduction in common shares outstanding | ✓ Repurchased shares and raised dividend |
...with opportunities ahead
- Maintain risk and control infrastructure
- Grow revenue through scale of franchise and breadth and quality of products and capabilities
- Continue to execute on efficiency initiatives
- Invest in higher returning businesses – Credit Card, Wealth Management, CIB
- Focus on capital optimization and managing our CET1 ratio down to 10–10.5%
> Targeting a 17-18% ROTCE over the medium-term
3Q25 Financial Results
© 2025 Wells Fargo Bank, N.A. All rights reserved.

3Q25 results
Financial Results
ROE: 12.8% | ROTCE: 15.2%¹ | Efficiency ratio: 65%²
- Net income of $5.6 billion, or $1.66 per diluted common share, included:
- $(296) million, or $(0.07) per share, of severance expense
- Revenue of $21.4 billion, up 5%
- Net interest income of $12.0 billion, up 2%
- Noninterest income of $9.5 billion, up 9%
- Noninterest expense of $13.8 billion, up 6%
- Pre-tax pre-provision profit³ of $7.6 billion, up 4%
- Effective income tax rate of 18.9%
- Average loans of $928.7 billion, up 2%
- Average deposits of $1.3 trillion, down slightly
Credit Quality
- Provision for credit losses⁴ of $681 million
- Total net loan charge-offs of $942 million, down $169 million, with net loan charge-offs of 0.40% of average loans (annualized)
- Allowance for credit losses for loans of $14.3 billion, down 3%
Capital and Liquidity
CET1 ratio: 11.0%⁵ | LCR: 121%⁶ | TLAC ratio: 24.6%⁷
- Common Equity Tier 1 (CET1) capital⁵ of $136.6 billion
- CET1 ratio⁵ of 11.0% under the Standardized Approach
- Liquidity coverage ratio (LCR)⁶ of 121%
Comparisons in the bullet points are for 3Q25 versus 3Q24, unless otherwise noted. Endnotes are presented starting on page 29.

3Q25 earnings
| $ in millions, except per share data | 3Q25 | 2Q25 | 3Q24 | $ Change from 2Q25 | $ Change from 3Q24 |
|---|---|---|---|---|---|
| Net interest income | $11,950 | 11,708 | 11,690 | $242 | 260 |
| Noninterest income | 9,486 | 9,114 | 8,676 | 372 | 810 |
| Total revenue | 21,436 | 20,822 | 20,366 | 614 | 1,070 |
| Net charge-offs | 954 | 997 | 1,111 | (43) | (157) |
| Change in the allowance for credit losses | (273) | 8 | (46) | (281) | (227) |
| Provision for credit losses¹ | 681 | 1,005 | 1,065 | (324) | (384) |
| Noninterest expense | 13,846 | 13,379 | 13,067 | 467 | 779 |
| Pre-tax income | 6,909 | 6,438 | 6,234 | 471 | 675 |
| Income tax expense | 1,300 | 916 | 1,064 | 384 | 236 |
| Effective income tax rate (%) | 18.9% | 14.3 | 17.2 | 458 bps | 165 |
| Net income | $5,589 | 5,494 | 5,114 | $95 | 475 |
| Diluted earnings per common share | $1.66 | 1.60 | 1.42 | $0.06 | 0.24 |
| Diluted average common shares (# mm) | 3,223.5 | 3,267.0 | 3,425.1 | (44) | (202) |
| Return on equity (ROE) | 12.8% | 12.8 | 11.7 | 3 bps | 111 |
| Return on average tangible common equity (ROTCE)² | 15.2 | 15.2 | 13.9 | — | 133 |
| Efficiency ratio | 65 | 64 | 64 | 34 | 43 |
Endnotes are presented starting on page 29.
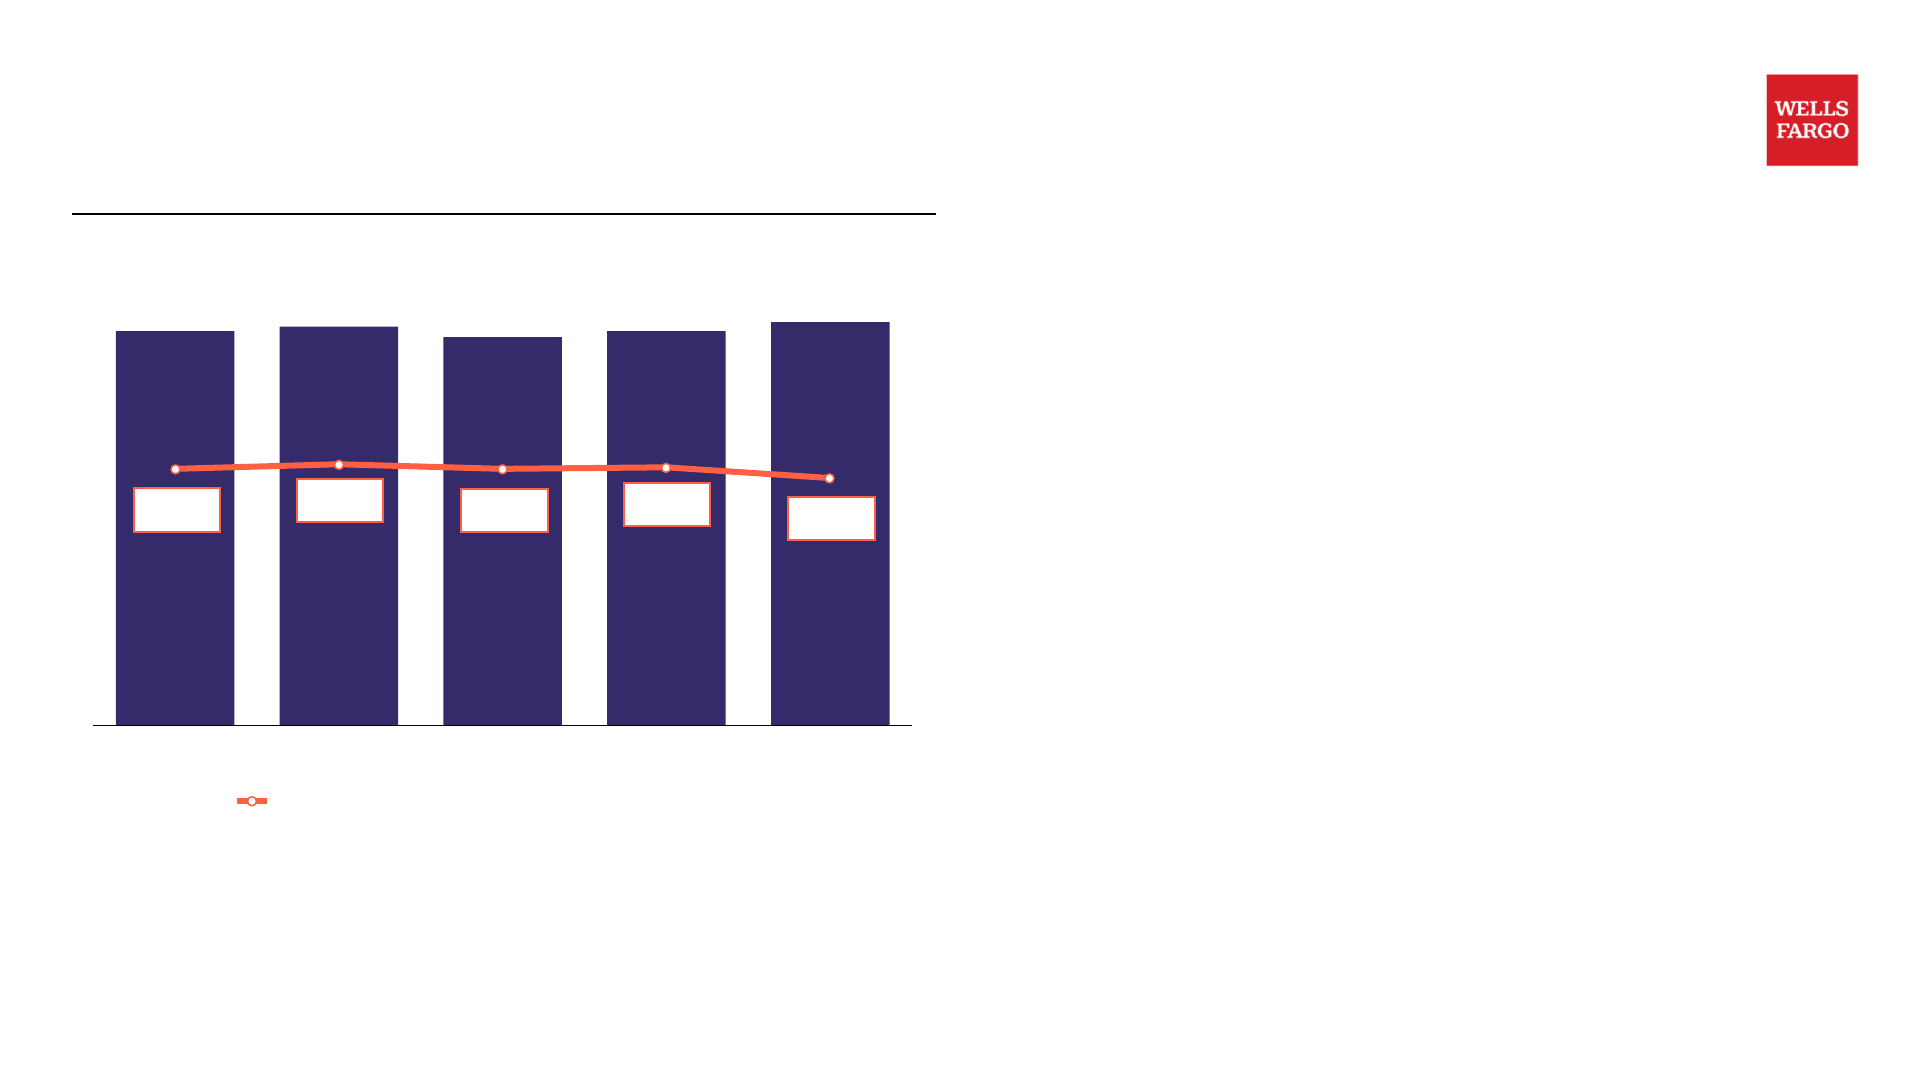
Net interest income
Net Interest Income ($ in millions)
| 분기 | NII | NIM |
|---|---|---|
| 3Q24 | $11,690 | 2.67% |
| 4Q24 | $11,836 | 2.70% |
| 1Q25 | $11,495 | 2.67% |
| 2Q25 | $11,708 | 2.68% |
| 3Q25 | $11,950 | 2.61% |
- Net interest income up $260 million, or 2%, from 3Q24 driven by fixed rate asset repricing, improved results in our Markets business, and higher investment securities and loan balances, partially offset by deposit mix changes
- Net interest income up $242 million, or 2%, from 2Q25 driven by one additional day in the quarter, higher loan and investment securities balances, and fixed rate asset repricing, partially offset by deposit mix changes
- NIM of 2.61% down 7 bps predominantly due to growth in lower-yielding Markets trading assets
Endnotes are presented starting on page 29.
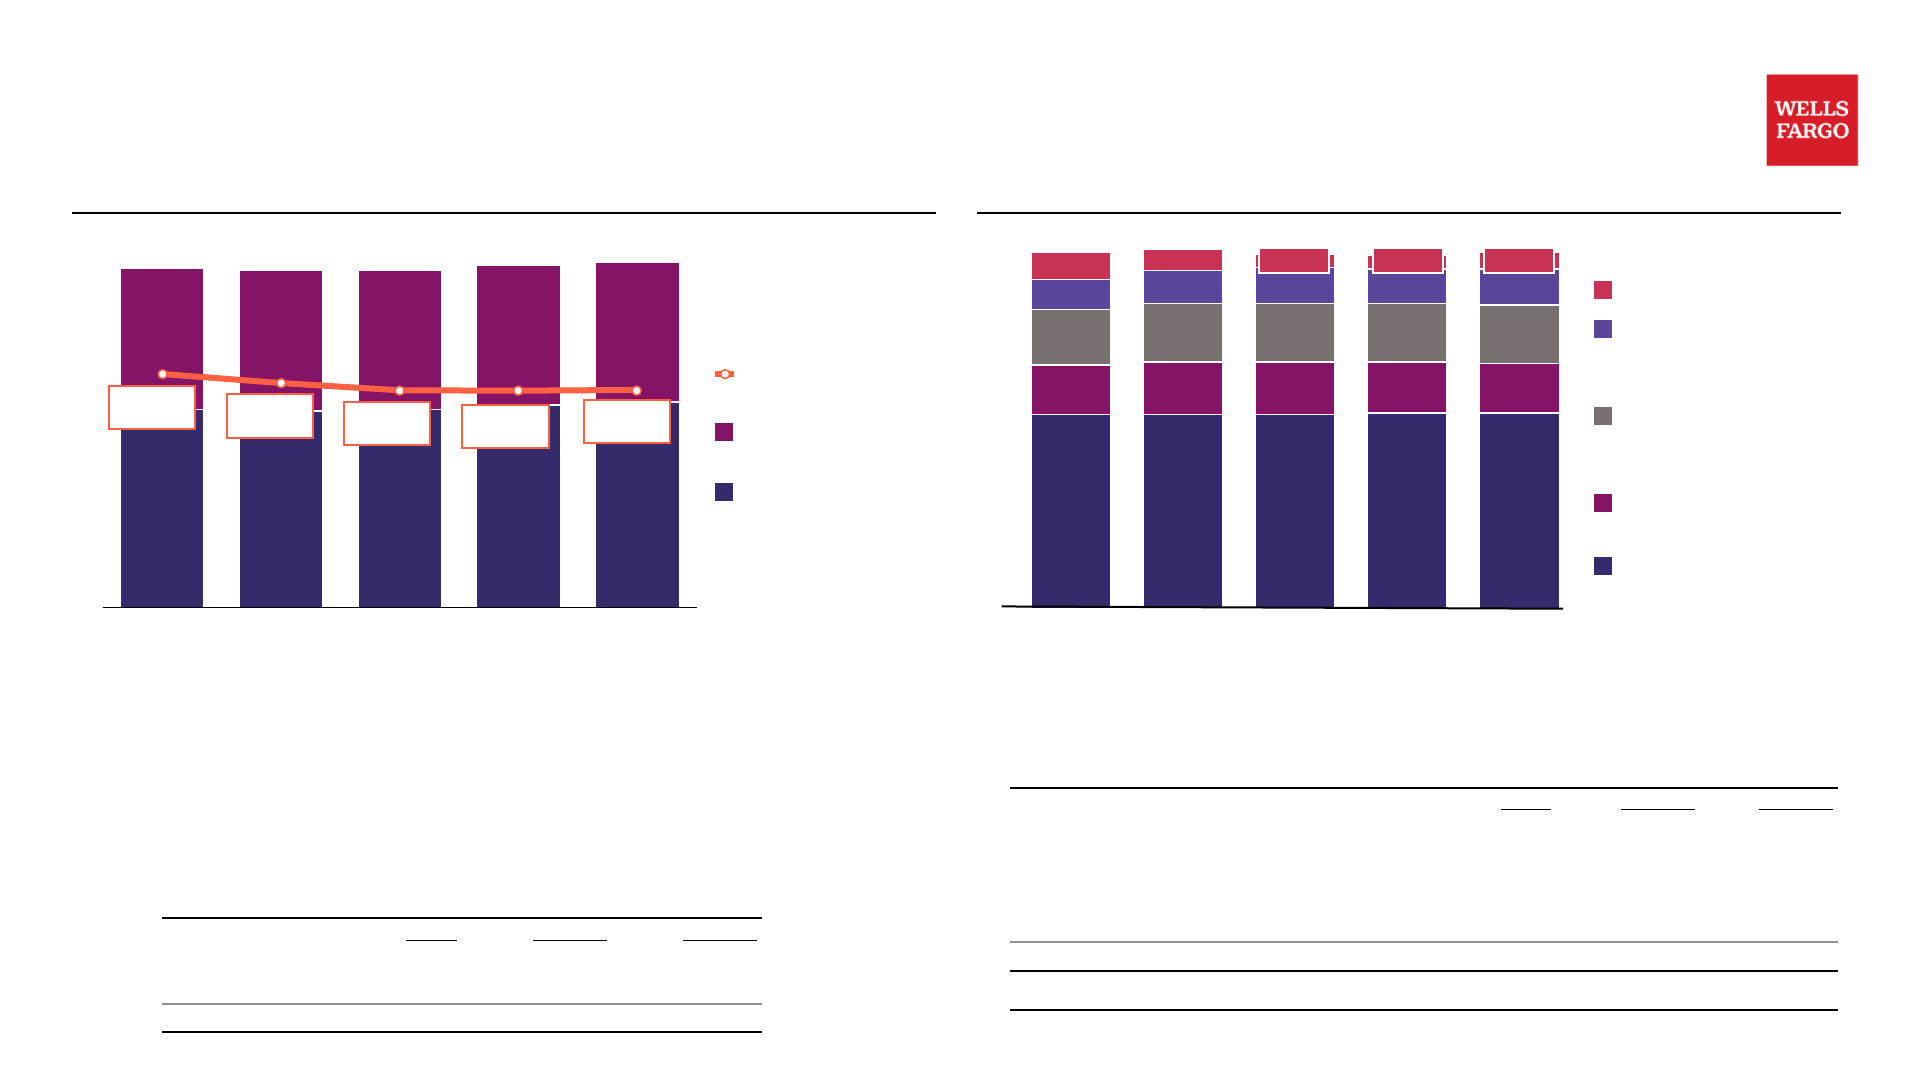
Loans and deposits
Average Loans Outstanding ($ in billions)
| 분기 | Consumer | Commercial | Total | Avg Loan Yield |
|---|---|---|---|---|
| 3Q24 | 379.6 | 530.6 | 910.3 | 6.41% |
| 4Q24 | 378.1 | 528.3 | 906.4 | 6.16% |
| 1Q25 | 375.0 | 533.2 | 908.2 | 5.96% |
| 2Q25 | 373.4 | 543.3 | 916.7 | 5.95% |
| 3Q25 | 376.3 | 552.4 | 928.7 | 5.97% |
Period-End Loans Outstanding ($ in billions)
| 3Q25 | vs 2Q25 | vs 3Q24 | |
|---|---|---|---|
| Commercial | $563.5 | 2% | 6% |
| Consumer | 379.6 | 1 | — |
| Total loans | $943.1 | 2% | 4% |
Average Deposits ($ in billions)
| 분기 | CBL | CB | CIB | WIM | Corporate | Total |
|---|---|---|---|---|---|---|
| 3Q24 | 773.6 | 173.2 | 194.3 | 108.0 | 92.6 | 1,341.7 |
| 4Q24 | 773.6 | 184.3 | 205.1 | 118.3 | 72.5 | 1,353.8 |
| 1Q25 | 778.6 | 182.9 | 203.9 | 123.4 | 50.5 | 1,339.3 |
| 2Q25 | 781.4 | 178.0 | 202.4 | 123.6 | 46.3 | 1,331.7 |
| 3Q25 | 781.3 | 172.0 | 204.1 | 127.4 | 55.1 | 1,339.9 |
Period-End Deposits ($ in billions)
| 3Q25 | vs 2Q25 | vs 3Q24 | |
|---|---|---|---|
| Consumer Banking and Lending | $782.3 | —% | 1% |
| Commercial Banking | 176.9 | (2) | (1) |
| Corporate and Investment Banking | 211.1 | 1 | 6 |
| Wealth and Investment Management (WIM) | 132.7 | 8 | 18 |
| Corporate | 64.4 | NM | NM |
| Total deposits | $1,367.4 | 2% | 1% |
| Average deposit cost | 1.54% | 0.02 | (0.37) |
- Average loans up $18.4 billion, or 2%, year-over-year (YoY) as higher commercial and industrial loans, securities-based loans in WIM, credit card loans, and auto loans were partially offset by declines in commercial real estate and residential mortgage loans; up $12.0 billion, or 1%, from 2Q25 driven by higher commercial and industrial, auto, and credit card loans
- Total average loan yield of 5.97%, down 44 bps YoY reflecting the impact of lower interest rates; up 2 bps from 2Q25
- Period-end loans up $33.4 billion YoY and up $18.7 billion from 2Q25
- Average deposits down $1.8 billion YoY predominantly driven by a reduction in higher cost CDs issued by Corporate Treasury; up $8.2 billion, or 1%, from 2Q25
- Period-end deposits up $17.8 billion YoY and up $26.7 billion from 2Q25
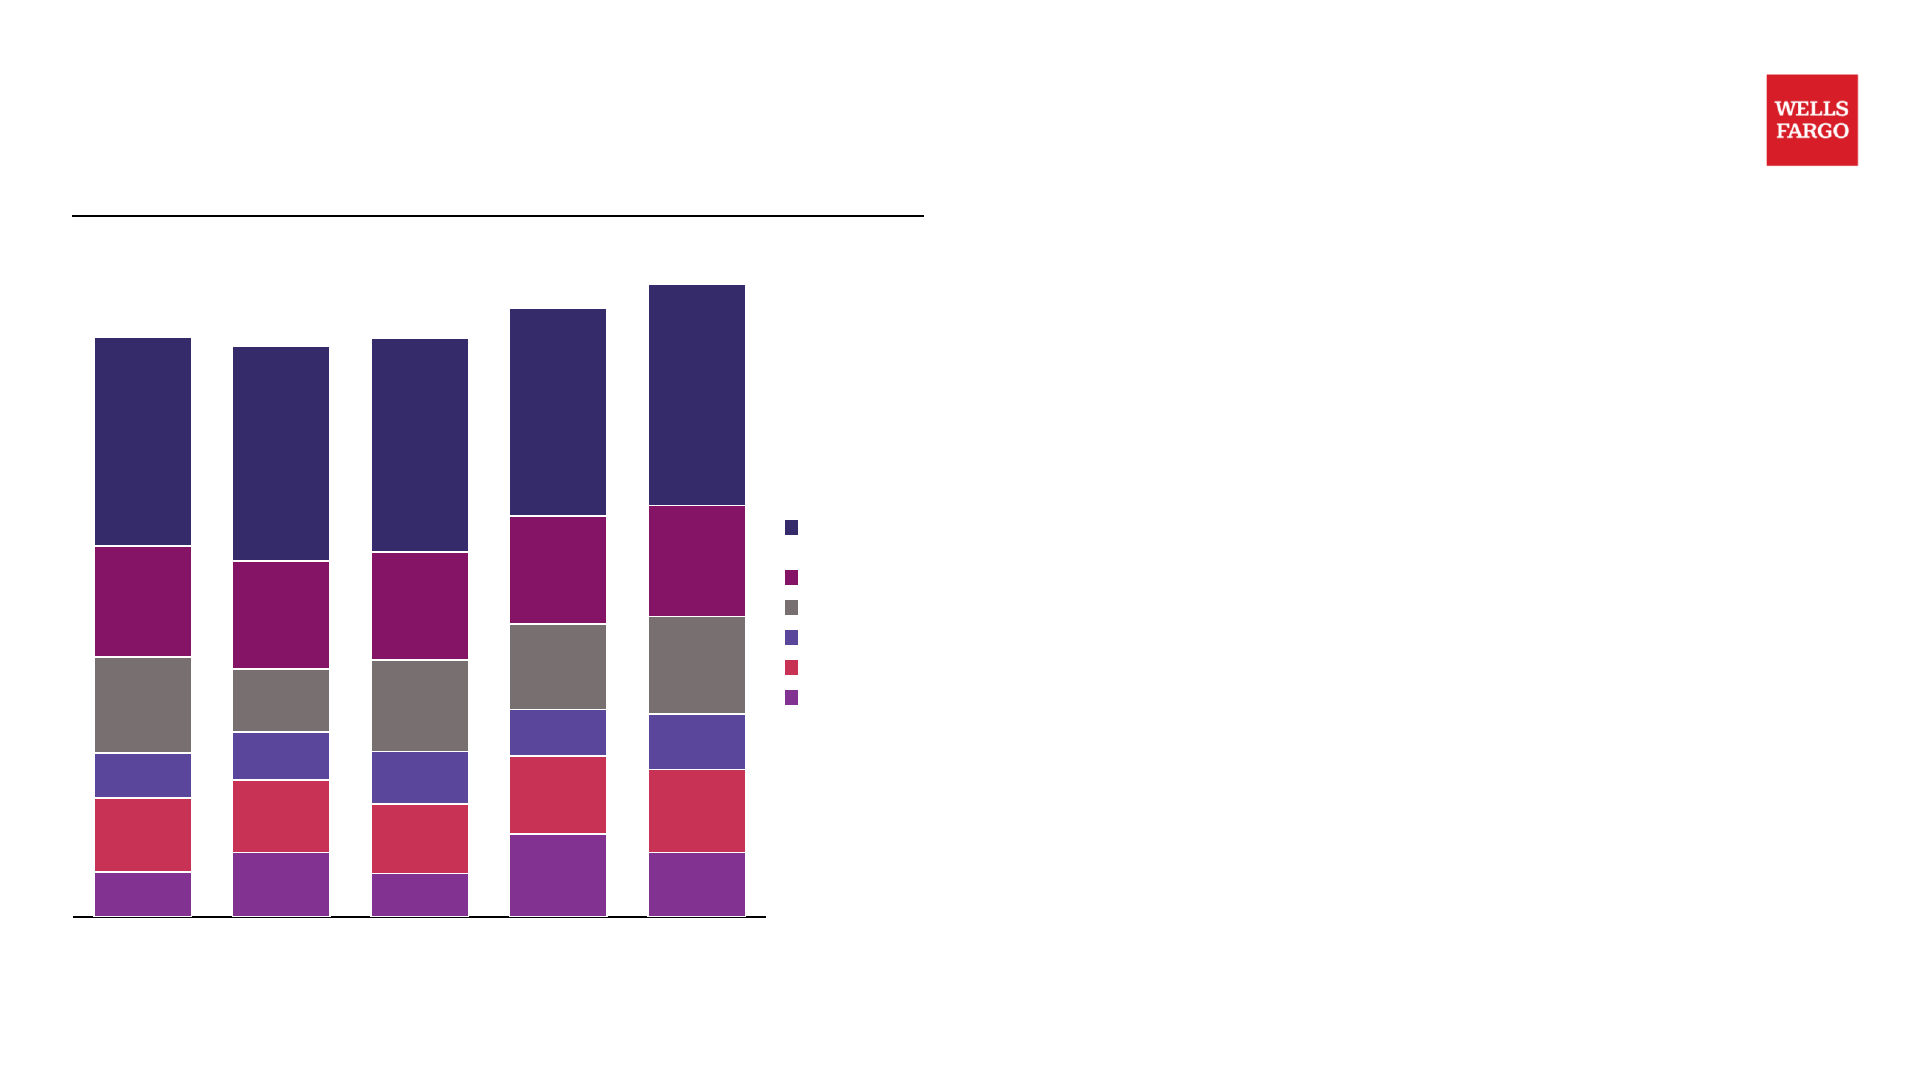
Noninterest income
Noninterest Income ($ in millions)
| 항목 | 3Q24 | 4Q24 | 1Q25 | 2Q25 | 3Q25 |
|---|---|---|---|---|---|
| Investment advisory fees & brokerage commissions¹ | 3,109 | 3,201 | 3,174 | 3,109 | 3,311 |
| Deposit and lending-related fees | 1,675 | 1,625 | 1,633 | 1,622 | 1,674 |
| Net gains from trading activities | 1,438 | 950 | 1,373 | 1,270 | 1,466 |
| Investment banking fees | 672 | 725 | 775 | 696 | 840 |
| Card fees² | 1,096 | 1,084 | 1,044 | 1,173 | 1,223 |
| All other³ | 686 | 957 | 655 | 1,244 | 972 |
| Total | 8,676 | 8,542 | 8,654 | 9,114 | 9,486 |
- Noninterest income up $810 million, or 9%, from 3Q24
- Investment advisory fees and brokerage commissions¹ up $202 million, or 6%, driven by higher asset-based fees reflecting higher market valuations
- Investment banking fees up $168 million, or 25%, on higher debt capital markets, advisory, and equity underwriting fees
- Card fees² up $127 million, or 12%, on higher merchant processing card fees, as well as increased consumer credit card activity
- All other³ up $286 million as 3Q24 included $447 million of net losses due to a repositioning of the investment securities portfolio, partially offset by lower net gains from equity securities
- Noninterest income up $372 million, or 4%, from 2Q25
- Investment advisory fees and brokerage commissions¹ up $202 million, or 6%, driven by higher asset-based fees reflecting higher market valuations, as well as higher retail brokerage commissions on higher transactional activity
- Net gains from trading activities up $196 million, or 15%, on higher revenue in commodities and equities
- Investment banking fees up $144 million, or 21%, on higher debt capital markets and equity underwriting fees
- All other³ down $272 million from a 2Q25 which included a $253 million gain associated with the merchant services joint venture acquisition
Endnotes are presented starting on page 29.
Noninterest expense
Noninterest Expense ($ in millions)
| 항목 | 3Q24 | 4Q24 | 1Q25 | 2Q25 | 3Q25 |
|---|---|---|---|---|---|
| Operating Losses | 293 | 338 | 143 | 311 | 285 |
| Personnel Expense | 8,591 | 8,424¹ | 9,474 | 8,709 | 8,725¹ |
| (of which: Severance) | — | (647) | — | — | (296) |
| Non-personnel Expense | 4,183 | 4,491 | 4,274 | 4,359 | 4,540 |
| Total | 13,067 | 13,900 | 13,891 | 13,379 | 13,846 |
Headcount (Period-end, '000s)
| 3Q24 | 4Q24 | 1Q25 | 2Q25 | 3Q25 |
|---|---|---|---|---|
| 220 | 218 | 215 | 213 | 211 |
- Noninterest expense up $779 million, or 6%, from 3Q24
- Personnel expense up $430 million driven by $296 million of severance expense, as well as higher revenue-related compensation expense predominantly in Wealth and Investment Management, partially offset by the impact of efficiency initiatives
- Non-personnel expense up $357 million, or 9%, and included higher technology and equipment, advertising and promotion, and professional and outside services expense, partially offset by the impact of efficiency initiatives
- Noninterest expense up $467 million, or 3%, from 2Q25
- Personnel expense up $312 million on higher severance expense and higher revenue-related compensation expense predominantly in Wealth and Investment Management
- Non-personnel expense up $181 million, or 4%, and included higher professional and outside services, technology and equipment, and advertising and promotion expense, partially offset by the impact of efficiency initiatives
Endnotes are presented starting on page 29.
Credit quality: net loan charge-offs
Provision for Credit Losses¹ and Net Loan Charge-offs ($ in millions)
| 분기 | Provision | Net Charge-offs | NCO Ratio |
|---|---|---|---|
| 3Q24 | 1,065 | 1,111 | 0.49% |
| 4Q24 | 1,211 | 1,095 | 0.53% |
| 1Q25 | 932 | 1,009 | 0.45% |
| 2Q25 | 1,005 | 997 | 0.44% |
| 3Q25 | 681 | 942 | 0.40% |
- Commercial net loan charge-offs up $3 million to 18 bps of average loans (annualized) as higher commercial real estate (CRE) and lease financing net loan charge-offs were largely offset by lower commercial and industrial net loan charge-offs
- CRE net loan charge-offs of $107 million, or 32 bps of average loans (annualized), up $46 million
- Consumer net loan charge-offs down $58 million to 73 bps of average loans (annualized) as lower credit card and residential mortgage net loan charge-offs were partially offset by higher auto net loan charge-offs
- Nonperforming assets of $7.8 billion, down $132 million, or 2%, predominantly driven by a decline in commercial real estate nonaccrual loans
Comparisons in the bullet points are for 3Q25 versus 2Q25. Endnotes are presented starting on page 29.
Credit quality: allowance for credit losses for loans
Allowance for Credit Losses for Loans ($ in millions)
| 분기 | Commercial | Consumer | Total | Coverage |
|---|---|---|---|---|
| 3Q24 | 8,092 | 6,647 | 14,739 | 1.62% |
| 4Q24 | 7,946 | 6,690 | 14,636 | 1.60% |
| 1Q25 | 7,930 | 6,622 | 14,552 | 1.59% |
| 2Q25 | 7,835 | 6,733 | 14,568 | 1.58% |
| 3Q25 | 7,552 | 6,759 | 14,311 | 1.52% |
- Allowance for credit losses (ACL) for loans down $257 million reflecting improved credit performance and lower commercial real estate loan balances, partially offset by higher commercial & industrial, auto, and credit card loan balances
- Allowance coverage for total loans down 10 bps from 3Q24 and down 6 bps from 2Q25
- CRE office ACL of $1.8 billion, down $209 million
- CRE office ACL as a % of loans of 7.5%, down from 7.9%
- Corporate and Investment Banking (CIB) CRE office ACL as a % of loans of 10.8%, down from 11.1%
- CRE nonaccrual loans of $3.3 billion, down $222 million, or 6%, and included an $82 million decrease in CRE office nonaccrual loans as payoffs/paydowns outpaced migration to nonaccrual loans
CRE Allowance for Credit Losses (ACL) and Nonaccrual Loans, as of 9/30/25
| ($ in millions) | Allowance for Credit Losses | Loans Outstanding | ACL as a % of Loans | Nonaccrual Loans |
|---|---|---|---|---|
| CIB CRE Office | $1,565 | 14,482 | 10.8% | $2,303 |
| All other CRE Office | 215 | 9,188 | 2.3 | 147 |
| Total CRE Office | 1,780 | 23,670 | 7.5 | 2,450 |
| All other CRE | 1,185 | 106,580 | 1.1 | 884 |
| Total CRE | $2,965 | 130,250 | 2.3% | $3,334 |
Comparisons in the bullet points are for 3Q25 versus 2Q25, unless otherwise noted.
Capital and liquidity
Common Equity Tier 1 Ratio under the Standardized Approach¹
| 분기 | CET1 비율 |
|---|---|
| 3Q24 | 11.3% |
| 4Q24 | 11.1% |
| 1Q25 | 11.1% |
| 2Q25 | 11.1% |
| 3Q25 (Estimated) | 11.0% |
→ 8.5% Regulatory Minimum and Buffers², effective 10/1/25
Capital Position
- Common Equity Tier 1 (CET1) ratio¹ of 11.0% at September 30, 2025
- CET1 ratio down 36 bps from 3Q24 and down 15 bps from 2Q25
- As of 10/1/25, the Company's stress capital buffer (SCB) decreased to 2.5% resulting in a CET1 regulatory minimum and buffers² of 8.5%
Capital Return
- $6.1 billion in gross common stock repurchases, or 74.6 million shares, in 3Q25; period-end common shares outstanding down 196.6 million, or 6%, from 3Q24
- 3Q25 common stock dividend increased to $0.45 per share, up from $0.40 per share in 2Q25; $1.4 billion in common stock dividends paid
Total Loss Absorbing Capacity (TLAC)
- As of September 30, 2025, our TLAC as a percentage of total risk-weighted assets³ was 24.6% compared with the required minimum of 21.5%
Liquidity Position
- Strong liquidity position with a 3Q25 LCR⁴ of 121% which remained above the regulatory minimum of 100%
Endnotes are presented starting on page 29.

Consumer Banking and Lending (CBL)
Summary Financials
| $ in millions (mm) | 3Q25 | vs. 2Q25 | vs. 3Q24 |
|---|---|---|---|
| Revenue by line of business: | |||
| Consumer, Small and Business Banking (CSBB) | $6,567 | $279 | 345 |
| Consumer Lending: | |||
| Home Lending | 870 | 49 | 28 |
| Credit Card | 1,663 | 75 | 192 |
| Auto | 256 | 15 | (17) |
| Personal Lending | 294 | 4 | (22) |
| Total revenue | 9,650 | 422 | 526 |
| Provision for credit losses | 767 | (178) | (163) |
| Noninterest expense | 5,968 | 169 | 344 |
| Pre-tax income | 2,915 | 431 | 345 |
| Net income | $2,185 | $322 | 261 |
Selected Metrics and Average Balances
| $ in billions | 3Q25 | 2Q25 | 3Q24 |
|---|---|---|---|
| Return on allocated capital¹ | 18.5% | 15.9 | 16.3 |
| Efficiency ratio² | 62 | 63 | 62 |
| Average loans³ | $325.3 | 315.4 | 323.6 |
| Average deposits³ | 781.3 | 781.4 | 773.6 |
| Retail bank branches (#, period-end) | 4,108 | 4,135 | 4,196 |
| Mobile active customers⁴ (# in mm, period-end) | 32.5 | 32.1 | 31.2 |
Other Selected Metrics
| $ in billions | 3Q25 | 2Q25 | 3Q24 |
|---|---|---|---|
| Debit card purchase volume⁵ | $133.6 | 133.6 | 126.8 |
| Average Home Lending loans | 201.8 | 203.6 | 209.8 |
| Mortgage loan originations | 7.0 | 7.4 | 5.5 |
| Average Credit Card loans | 51.1 | 49.9 | 49.1 |
| Credit Card purchase volume⁵ | 47.4 | 46.4 | 43.4 |
| Credit Card new accounts (# in thousands) | 914 | 643 | 615 |
| Average Auto loans | $44.8 | 42.4 | 43.9 |
| Auto loan originations | 8.8 | 6.9 | 4.1 |
- Total revenue up 6% YoY and up 5% from 2Q25
- CSBB up 6% YoY driven by lower deposit pricing and higher deposit and loan balances, including the impact of the transfer of certain business customers³; up 4% from 2Q25
- Home Lending up 3% YoY and up 6% from 2Q25 on higher mortgage banking fees including gains on the sales of mortgage servicing rights
- Credit Card up 13% YoY and included higher loan balances and higher card fees
- Auto down 6% YoY on loan spread compression; up 6% from 2Q25 driven by higher loan balances
- Personal Lending down 7% YoY driven by lower loan balances
- Noninterest expense up 6% YoY reflecting higher operating costs, higher advertising expense, and the impact of the transfer of certain business customers³, partially offset by the impact of efficiency initiatives
Endnotes are presented starting on page 29.

Commercial Banking (CB)
Summary Financials
| $ in millions | 3Q25 | vs. 2Q25 | vs. 3Q24 |
|---|---|---|---|
| Net interest income | $1,949 | ($34) | (340) |
| Noninterest income | 1,092 | 142 | 48 |
| Total revenue | 3,041 | 108 | (292) |
| Provision for credit losses | 39 | 82 | (46) |
| Noninterest expense | 1,445 | (74) | (35) |
| Pre-tax income | 1,557 | 100 | (211) |
| Net income | $1,162 | $76 | (156) |
Selected Metrics
| 3Q25 | 2Q25 | 3Q24 | |
|---|---|---|---|
| Return on allocated capital | 16.8% | 15.8 | 19.2 |
| Efficiency ratio | 48 | 52 | 44 |
| Average balances ($ in billions) | |||
| Loans¹ | $219.4 | 226.5 | 222.1 |
| Deposits¹ | 172.0 | 178.0 | 173.2 |
- Total revenue down 9% YoY and up 4% from 2Q25
- Net interest income down 15% YoY and 2% from 2Q25 driven by the impact of lower interest rates and lower deposit and loan balances, including the impact of the transfer of certain business customers¹, partially offset by lower deposit pricing
- Noninterest income up 5% YoY and 15% from 2Q25 on higher revenue from tax credit investments and equity investments
- Noninterest expense down 2% YoY and 5% from 2Q25 due to the impact of the transfer of certain business customers¹, as well as the impact of efficiency initiatives
Endnotes are presented starting on page 29.

Corporate and Investment Banking (CIB)
Summary Financials
| $ in millions | 3Q25 | vs. 2Q25 | vs. 3Q24 |
|---|---|---|---|
| Revenue by line of business: | |||
| Banking: | |||
| Lending | $647 | $46 | (51) |
| Treasury Management and Payments | 630 | 19 | (65) |
| Investment Banking | 554 | 91 | 135 |
| Total Banking | 1,831 | 156 | 19 |
| Commercial Real Estate | 1,186 | (26) | (178) |
| Markets: | |||
| Fixed Income, Currencies and Commodities (FICC) | 1,355 | (36) | 28 |
| Equities | 450 | 63 | 54 |
| Credit Adjustment (CVA/DVA/FVA) and Other | 48 | 47 | 17 |
| Total Markets | 1,853 | 74 | 99 |
| Other | 9 | 2 | 28 |
| Total revenue | 4,879 | 206 | (32) |
| Provision for credit losses | (107) | (210) | (133) |
| Noninterest expense | 2,362 | 111 | 133 |
| Pre-tax income | 2,624 | 305 | (32) |
| Net income | $1,966 | $229 | (26) |
Selected Metrics
| 3Q25 | 2Q25 | 3Q24 | |
|---|---|---|---|
| Return on allocated capital | 16.8% | 14.9 | 17.1 |
| Efficiency ratio | 48 | 48 | 45 |
Average Balances ($ in billions)
| Loans by line of business | 3Q25 | 2Q25 | 3Q24 |
|---|---|---|---|
| Banking | $92.8 | 89.0 | 86.5 |
| Commercial Real Estate | 117.1 | 117.9 | 124.1 |
| Markets | 86.0 | 79.0 | 64.6 |
| Total loans | $295.9 | 285.9 | 275.2 |
| Deposits | 204.1 | 202.4 | 194.3 |
| Trading-related assets | 306.4 | 274.6 | 234.2 |
- Total revenue down 1% YoY and up 4% from 2Q25
- Banking revenue up 1% YoY on higher investment banking revenue; up 9% from 2Q25 on higher investment banking revenue and higher loan balances
- Commercial Real Estate revenue down 13% YoY on lower loan balances, the impact of lower interest rates, and lower revenue resulting from the sale of our non-agency third party servicing business in 1Q25, partially offset by increased capital markets activity
- Markets revenue up 6% YoY driven by higher revenue in equities, commodities, foreign exchange, and credit products, partially offset by lower revenue in rates products; up 4% from 2Q25 on higher revenue in equities, credit products, and commodities
- Noninterest expense up 6% YoY driven by higher operating costs and higher professional and outside services expense, partially offset by the impact of efficiency initiatives; up 5% from 2Q25 driven by higher personnel expense and higher professional and outside services expense

Wealth and Investment Management (WIM)
Summary Financials
| $ in millions | 3Q25 | vs. 2Q25 | vs. 3Q24 |
|---|---|---|---|
| Net interest income | $974 | $83 | 132 |
| Noninterest income | 3,222 | 215 | 186 |
| Total revenue | 4,196 | 298 | 318 |
| Provision for credit losses | (14) | (26) | (30) |
| Noninterest expense | 3,421 | 176 | 267 |
| Pre-tax income | 789 | 148 | 81 |
| Net income | $591 | $111 | 62 |
Selected Metrics
| $ in billions | 3Q25 | 2Q25 | 3Q24 |
|---|---|---|---|
| Return on allocated capital | 35.1% | 28.7 | 31.5 |
| Efficiency ratio | 82 | 83 | 81 |
| Average loans | $86.2 | 84.9 | 82.8 |
| Average deposits | 127.4 | 123.6 | 108.0 |
| Client assets | |||
| Advisory assets | 1,104 | 1,042 | 993 |
| Other brokerage assets and deposits | 1,369 | 1,304 | 1,301 |
| Total client assets | $2,473 | 2,346 | 2,294 |
- Total revenue up 8% YoY and up 8% from 2Q25
- Net interest income up 16% YoY and up 9% from 2Q25 driven by lower deposit pricing and higher deposit and loan balances
- Noninterest income up 6% YoY on higher asset-based fees driven by an increase in market valuations; up 7% from 2Q25 driven by higher asset-based fees on higher market valuations, as well as higher retail brokerage commissions on higher transactional activity
- Noninterest expense up 8% YoY on higher revenue-related compensation expense and operating costs, partially offset by the impact of efficiency initiatives; up 5% from 2Q25 on higher revenue-related compensation expense

Corporate
Summary Financials
| $ in millions | 3Q25 | vs. 2Q25 | vs. 3Q24 |
|---|---|---|---|
| Net interest income | ($273) | ($170) | 142 |
| Noninterest income | 449 | (213) | 371 |
| Total revenue | 176 | (383) | 513 |
| Provision for credit losses | (4) | 8 | (12) |
| Noninterest expense | 650 | 85 | 70 |
| Pre-tax loss | (470) | (476) | 455 |
| Income tax benefit | (173) | 175 | 157 |
| Less: Net income from noncontrolling interests | 18 | (8) | (36) |
| Net loss | ($315) | ($643) | 334 |
- Revenue increased YoY as 3Q24 included $447 million of net losses on debt securities due to a repositioning of the investment securities portfolio
- Noninterest expense up YoY as higher severance expense was partially offset by lower operating losses

Outlook
Net Interest Income
Expect 2025 net interest income (NII) to be roughly in line with 2024 NII of $47.7 billion, unchanged from prior guidance
- Expect 4Q25 net interest income to be ~$12.4–$12.5 billion
- Net interest income performance will ultimately be determined by a variety of factors, many of which are uncertain, including the absolute level of rates and the shape of the yield curve; deposit balances, mix and pricing; and loan demand
Noninterest Expense
Expect 2025 noninterest expense to be ~$54.6 billion, up from prior guidance of ~$54.2 billion, and includes:
- Higher severance expense of ~$200 million
- Higher revenue-related compensation expense of ~$200 million, predominantly in WIM, driven by strong market performance in the second half of 2025
Expect 4Q25 noninterest expense to be ~$13.5 billion

Endnotes: Firm Update
Page 3 – Wells Fargo is a U.S. focused bank and benefits from the strength of the U.S. economy
- Based on U.S. Bureau of Economic Analysis and U.S. Census Bureau data. Nominal GDP as of 2Q25 and Real GDP growth is a 3-year CAGR 2Q22–2Q25.
- Based on the Wilshire 5000 Total Market Index as of 9/30/2025.
Page 4 – Scale matters and we have it in all of our businesses
- CBL: Deposit share is based on SNL Financial deposits data as of 6/30/2025 and Wells Fargo estimates. Branches, mobile active customers, and credit card loans are reported as of 3Q25. Branch rank based on 2Q25 company filings.
- WIM: Client assets as of 3Q25. Financial Advisors and Wealth Client Assets rankings are based on company filings and Wells Fargo estimates at year-end 2024.
- CIB: U.S. C&I Loans ranking based on FR Y-9C data for 2Q25 and includes U.S. Commercial and Industrial (C&I) loans and Non-Depository Financial Institution (NDFI) loans with a U.S. address. U.S. Investment Banking Market Share based on 2024 Dealogic data. Percentage relationships with S&P 500 is a Wells Fargo estimate. Bank CRE Loan Portfolio ranking based on company filings and Wells Fargo estimates as of 2Q25.
- CB: Middle Market companies banked based on Coalition Greenwich 2024 data. Average client relationship tenure based on Wells Fargo estimates. Left Lead Arranger ranking is based on Refinitiv / London Stock Exchange Group (LSEG) market data deal volume ($) for year-end 2024 with Middle Market defined as deals < $500mm and company sales size < $500mm.
**Page 8 – We have made progress improving returns, with a goal to achieve best in class returns for each segment over time
| 3Q25 Financial Results | 29 |
|---|---|
| Endnotes: Financial Results | |
| Page 13 – 3Q25 results | |
| 1. Tangible common equity and return on average tangible common equity (ROTCE) are non-GAAP financial measures. For additional information, including a corresponding reconciliation to GAAP financial measures, see the | |
| “Tangible Common Equity” table on page 31. | |
| 2. The efficiency ratio is noninterest expense divided by total revenue (net interest income and noninterest income). | |
| 3. Pre-tax pre-provision profit (PTPP) is total revenue less noninterest expense. Management believes that PTPP is a useful financial measure because it enables investors and others to assess the Company’s ability to | |
| generate capital to cover credit losses through a credit cycle. | |
| 4. Includes provision for credit losses for loans, debt securities, and other financial assets. | |
| 5. The Common Equity Tier 1 (CET1) ratio calculated under the Standardized Approach is our binding CET1 ratio. See page 32 for additional information regarding CET1 capital and ratios. CET1 for September 30, 2025, is a | |
| preliminary estimate. | |
| 6. Liquidity coverage ratio (LCR) represents average high-quality liquid assets divided by average projected net cash outflows, as each is defined under the LCR rule. LCR forSeptember 30, 2025, is a preliminary estimate. | |
| 7. Represents total loss absorbing capacity (TLAC) divided by risk-weighted assets (RWAs), which is our binding TLAC ratio, determined by using the greater of RWAs under the Standardized and Advanced Approaches. TLAC | |
| for September 30, 2025, is a preliminary estimate. | |
| Page 14 – 3Q25 earnings | |
| 1. Includes provision for credit losses for loans, debt securities, and other financial assets. | |
| 2. Tangible common equity and return on average tangible common equity (ROTCE) are non-GAAP financial measures. For additional information, including a corresponding reconciliation to GAAP financial measures, see the | |
| “Tangible Common Equity” table on page 31. | |
| Page 15 – Net interest income | |
| 1. Includes taxable-equivalent adjustments predominantly related to tax-exempt income on certain loans and securities. | |
| Page 17 – Noninterest income | |
| 1. Investment advisory fees and brokerage commissions includes investment advisory and other asset-based fees and commissions and brokerage services fees. | |
| 2. In April 2025, we completed our acquisition of the remaining interest in our merchant services joint venture. Following the acquisition, the revenue from this business has been included in card fees. Prior to the acquisition, | |
| our share of the net earnings of the joint venture was included in other noninterest income. | |
| 3. All other includes mortgage banking, net losses from debt securities, net gains (losses) from equity securities, lease income, and other. | |
| Page 18 – Noninterest expense | |
| 1. 3Q25 and 4Q24 total personnel expense of $9.0 billion and $9.1 billion, respectively, included severance expense of $296 million and $647 million, respectively. |

| 3Q25 Financial Results | 30 |
|---|---|
| Page 19 – Credit quality: net loan charge-offs | |
| 1. Includes provision for credit losses for loans, debt securities, and other financial assets. | |
| Page 21 – Capital and liquidity | |
| 1. The Common Equity Tier 1 (CET1) ratio calculated under the Standardized Approach is our binding CET1 ratio. See page 32 for additional information regarding CET1 capital and ratios. 3Q25 CET1 is a preliminary estimate. | |
| 2. Includes a 4.50% minimum requirement, a stress capital buffer (SCB) of 2.50%, and a G-SIB capital surcharge of 1.50%. | |
| 3. Represents total loss absorbing capacity (TLAC) divided by risk-weighted assets (RWAs), which is our binding TLAC ratio, determined by using the greater of RWAs under the Standardized and Advanced Approaches. TLAC is | |
| a preliminary estimate. | |
| 4. Liquidity coverage ratio (LCR) represents average high-quality liquid assets divided by average projected net cash outflows, as each is defined under the LCR rule. 3Q25 LCR is a preliminary estimate. | |
| Page 22 – Consumer Banking and Lending | |
| 1. Return on allocated capital is segment net income (loss) applicable to common stock divided by segment average allocated capital. Segment net income (loss) applicable to common stock is segment net income (loss) less | |
| allocated preferred stock dividends. | |
| 2. Efficiency ratio is segment noninterest expense divided by segment total revenue. | |
| 3. In third quarter 2025, we prospectively transferred approximately $8 billion of loans and approximately $6 billion of deposits related to certain business customers from the Commercial Banking operating segment to | |
| Consumer, Small and Business Banking in the Consumer Banking and Lending operating segment. | |
| 4. Mobile active customers is the number of consumer and small business customers who have logged on via a mobile device in the prior 90 days. | |
| 5. Reflects combined activity for consumer and small business customers. | |
| Page 23 – Commercial Banking | |
| 1. In third quarter 2025, we prospectively transferred approximately $8 billion of loans and approximately $6 billion of deposits related to certain business customers from the Commercial Banking operating segment to | |
| Consumer, Small and Business Banking in the Consumer Banking and Lending operating segment. | |
| Endnotes (continued): Financial Results |

| 3Q25 Financial Results | 31 |
|---|---|
| Tangible Common Equity | |
| Wells Fargo & Company and Subsidiaries | |
| TANGIBLE COMMON EQUITY | |
| We also evaluate our business based on certain ratios that utilize tangible common equity. Tangible common equity is a non-GAAP financial measure and represents total equity | |
| less preferred equity, noncontrolling interests, goodwill, certain identifiable intangible assets (other than MSRs) and goodwill and other intangibles on venture capital | |
| investments in consolidated portfolio companies, net of applicable deferred taxes. One of these ratios is return on average tangible common equity (ROTCE), which represents | |
| our annualized earnings as a percentage of tangible common equity. The methodology of determining tangible common equity may differ among companies. Management | |
| believes that return on average tangible common equity, which utilizes tangible common equity, is a useful financial measure because it enables management, investors, and | |
| others to assess the Company’s use of equity. | |
| The table below provides a reconciliation of this non-GAAP financial measure to GAAP financial measures. | |
| Quarter ended Nine months ended | |
| ($ in millions) | |
| Sep 30, | |
| 2025 | |
| Jun 30, | |
| 2025 | |
| Mar 31, | |
| 2025 | |
| Dec 31, | |
| 2024 | |
| Sep 30, | |
| 2024 | |
| Dec 31, | |
| 2020 | |
| Sep 30, | |
| 2025 | |
| Return on average tangible common equity: | |
| Net income applicable to common stock (A) $5,341 5,214 4,616 4,801 4,852 2,741 $15,171 | |
| Average total equity 183,428 183,268 183,358 182,933 184,368 185,444 183,351 | |
| Adjustments: | |
| Preferred stock (16,608) (18,278) (18,608) (18,608) (18,129) (21,223) (17,824) | |
| Additional paid-in capital on preferred stock 141 143 145 144 143 156 143 | |
| Unearned ESOP shares — — — — — 875 — | |
| Noncontrolling interests (1,850) (1,818) (1,894) (1,803) (1,748) (887) (1,854) | |
| Average common stockholders’ equity (B) 165,111 163,315 163,001 162,666 164,634 164,365 163,816 | |
| Adjustments: | |
| Goodwill (25,070) (25,070) (25,135) (25,170) (25,172) (26,390) (25,092) | |
| Certain identifiable intangible assets (other than MSRs) (889) (863) (69) (78) (89) (354) (610) | |
| Goodwill and other intangibles on venture capital investments in consolidated portfolio companies (included in other assets) (674) (674) (734) (772) (965) (1,889) (694) | |
| Applicable deferred taxes related to goodwill and other intangible assets | |
| 1 | |
| 1,061 989 952 945 938 852 1,001 | |
| Average tangible common equity (C) $139,539 137,697 138,015 137,591 139,346 136,584 $138,421 | |
| Return on average common stockholders’ equity (ROE) (annualized) (A)/(B) 12.8 % 12.8 11.5 11.7 11.7 6.6 12.4 % | |
| Return on average tangible common equity (ROTCE) (annualized) (A)/(C) 15.2 15.2 13.6 13.9 13.9 8.0 14.7 | |
| 1. Determined by applying the combined federal statutory rate and composite state income tax rates to the difference between book and tax basis of the respective goodwill and intangible assets at period-end. |

| 3Q25 Financial Results | 32 |
|---|---|
| 1. The Basel III capital rules provide for two capital frameworks (the Standardized Approach and the Advanced Approach applicable to certain institutions), and we must calculate our CET1, Tier 1 and total capital ratios under both approaches. | |
| 2. Determined by applying the combined federal statutory rate and composite state income tax rates to the difference between book and tax basis of the respective goodwill and intangible assets at period-end. | |
| Common Equity Tier 1 under Basel III | |
| Wells Fargo & Company and Subsidiaries | |
| RISK-BASED CAPITAL RATIOS UNDER BASEL III | |
| 1 | |
| Estimated | |
| ($ in billions) | |
| Sep 30, | |
| 2025 | |
| Jun 30, | |
| 2025 | |
| Mar 31, | |
| 2025 | |
| Dec 31, | |
| 2024 | |
| Sep 30, | |
| 2024 | |
| Total equity $183.0 183.0 182.9 181.1 185.0 | |
| Adjustments: | |
| Preferred stock (16.6) (16.6) (18.6) (18.6) (18.6) | |
| Additional paid-in capital on preferred stock 0.2 0.1 0.1 0.1 0.1 | |
| Noncontrolling interests (1.9) (1.9) (1.8) (1.9) (1.7) | |
| Total common stockholders' equity 164.7 164.6 162.6 160.7 164.8 | |
| Adjustments: | |
| Goodwill (25.1) (25.1) (25.1) (25.2) (25.2) | |
| Certain identifiable intangible assets (other than MSRs) (0.9) (0.9) (0.1) (0.1) (0.1) | |
| Goodwill and other intangibles on venture capital investments in consolidated portfolio companies (included in other assets) (0.7) (0.7) (0.7) (0.7) (0.8) | |
| Applicable deferred taxes related to goodwill and other intangible assets | |
| 2 | |
| 1.1 1.1 1.0 0.9 0.9 | |
| Other (2.5) (2.6) (2.1) (1.0) (1.3) | |
| Common Equity Tier 1 (A) $136.6 136.4 135.6 134.6 138.3 | |
| Total risk-weighted assets (RWAs) under the Standardized Approach (B) 1,243.8 1,225.9 1,222.0 1,216.1 1,219.9 | |
| Total RWAs under the Advanced Approach (C) 1,072.8 1,070.4 1,063.6 1,085.0 1,089.3 | |
| Common Equity Tier 1 to total RWAs under the Standardized Approach (A)/(B) 11.0 % 11.1 11.1 11.1 11.3 | |
| Common Equity Tier 1 to total RWAs under the Advanced Approach (A)/(C) 12.7 12.7 12.7 12.4 12.7 |
| 3Q25 Financial Results | 33 |
|---|---|
| Disclaimer and forward-looking statements | |
| Financial results reported in this document are preliminary. Final financial results and other disclosures will be reported in our Quarterly Report on Form 10-Q for the quarter ended | |
| September 30, 2025, and may differ materially from the results and disclosures in this document due to, among other things, the completion of final review procedures, the occurrence of | |
| subsequent events, or the discovery of additional information. | |
| This document contains forward-looking statements. In addition, we may make forward-looking statements in our other documents filed or furnished with the Securities and Exchange | |
| Commission, and our management may make forward-looking statements orally to analysts, investors, representatives of the media and others. Forward-looking statements can be identified | |
| by words such as “anticipates,” “intends,” “plans,” “seeks,” “believes,” “estimates,” “expects,” “target,” “projects,” “outlook,” “forecast,” “will,” “may,” “could,” “should,” “can” and similar | |
| references to future periods. In particular, forward-looking statements include, but are not limited to, statements we make about: (i) the future operating or financial performance of the | |
| Company or any of its businesses, including our outlook for future growth; (ii) our expectations regarding noninterest expense and our efficiency ratio; (iii) future credit quality and performance, | |
| including our expectations regarding future loan losses, our allowance for credit losses, and the economic scenarios considered to develop the allowance; (iv) our expectations regarding net | |
| interest income and net interest margin; (v) loan growth or the reduction or mitigation of risk in our loan portfolios; (vi) future capital or liquidity levels, ratios or targets; (vii) the expected | |
| outcome and impact of legal, regulatory and legislative developments, as well as our expectations regarding compliance therewith; (viii) future common stock dividends, common share | |
| repurchases and other uses of capital; (ix) our targeted range for return on assets, return on equity, and return on tangible common equity; (x) expectations regarding our effective income tax | |
| rate; (xi) the outcome of contingencies, such as legal actions; (xii) environmental, social and governance related goals or commitments; and (xiii) the Company’s plans, objectives and strategies. | |
| Forward-looking statements are not based on historical facts but instead represent our current expectations and assumptions regarding our business, the economy and other future conditions. | |
| Investors are urged to not unduly rely on forward-looking statements as actual results may differ materially from expectations. Forward-looking statements speak only as of the date made, and | |
| we do not undertake to update them to reflect changes or events that occur after that date. For additional information about factors that could cause actual results to differ materially from our | |
| expectations, refer to the “Forward-Looking Statements” discussion in Wells Fargo’s press release announcing our third quarter 2025 results and in our most recent Quarterly Report on | |
| Form 10-Q, as well as to Wells Fargo’s other reports filed with the Securities and Exchange Commission, including the discussion under “Risk Factors” in our Annual Report on Form 10-K for the | |
| year ended December 31, 2024. |