
SAMSUNG ELECTRONICS
Earnings Presentation: 4Q 2025 Financial Results

Disclaimer
The financial information in this document are consolidated earnings results based on K-IFRS.
This document is provided for the convenience of investors only before the external audit on our 4Q 2025 financial results is completed. The Audit outcomes may cause some parts of this document to change.
This document contains "forward-looking statements" - that is statements related to future not past events. In this context "forward-looking statements" often address our expected future business and financial performance and often contain words such as "expects" "anticipates" "intends" "plans" "believes" "seeks" or "will". "Forward-looking statements" by their nature address matters that are to different degrees uncertain. For us particular uncertainties which could adversely or positively affect our future results include:
· The behavior of financial markets including fluctuations in exchange rates interest rates and commodity prices · Strategic actions including dispositions and acquisitions · Unanticipated dramatic developments in our major businesses including DX (Digital eXperience) DS (Device Solutions) · Numerous other matters at the national and international levels which could affect our future results
These uncertainties may cause our actual results to be materially different from those expressed in this document.

Index
- PRESENTERS
- 4Q 2025 FINANCIAL RESULTS
- PERFORMANCE BY BUSINESS SEGMENT
- APPENDICES
Earnings Presentation
| Presenters | Moderator | ||||||
|---|---|---|---|---|---|---|---|
| Sooncheol Park, EVP | Jaejune Kim, EVP | Jason Shin, EVP | Sukchae Kang, EVP | Charles Hur, EVP | Seong Cho, EVP | Hun Lee, EVP | Daniel Oh, EVP |
| Chief Financial Officer | Memory | System LSI | Foundry | Samsung Display Corp | Mobile eXperience | Visual Display | Investor Relations |
| Device Solutions | Device eXperience |
4Q 2025 Highlights
Based on consolidated financial statements
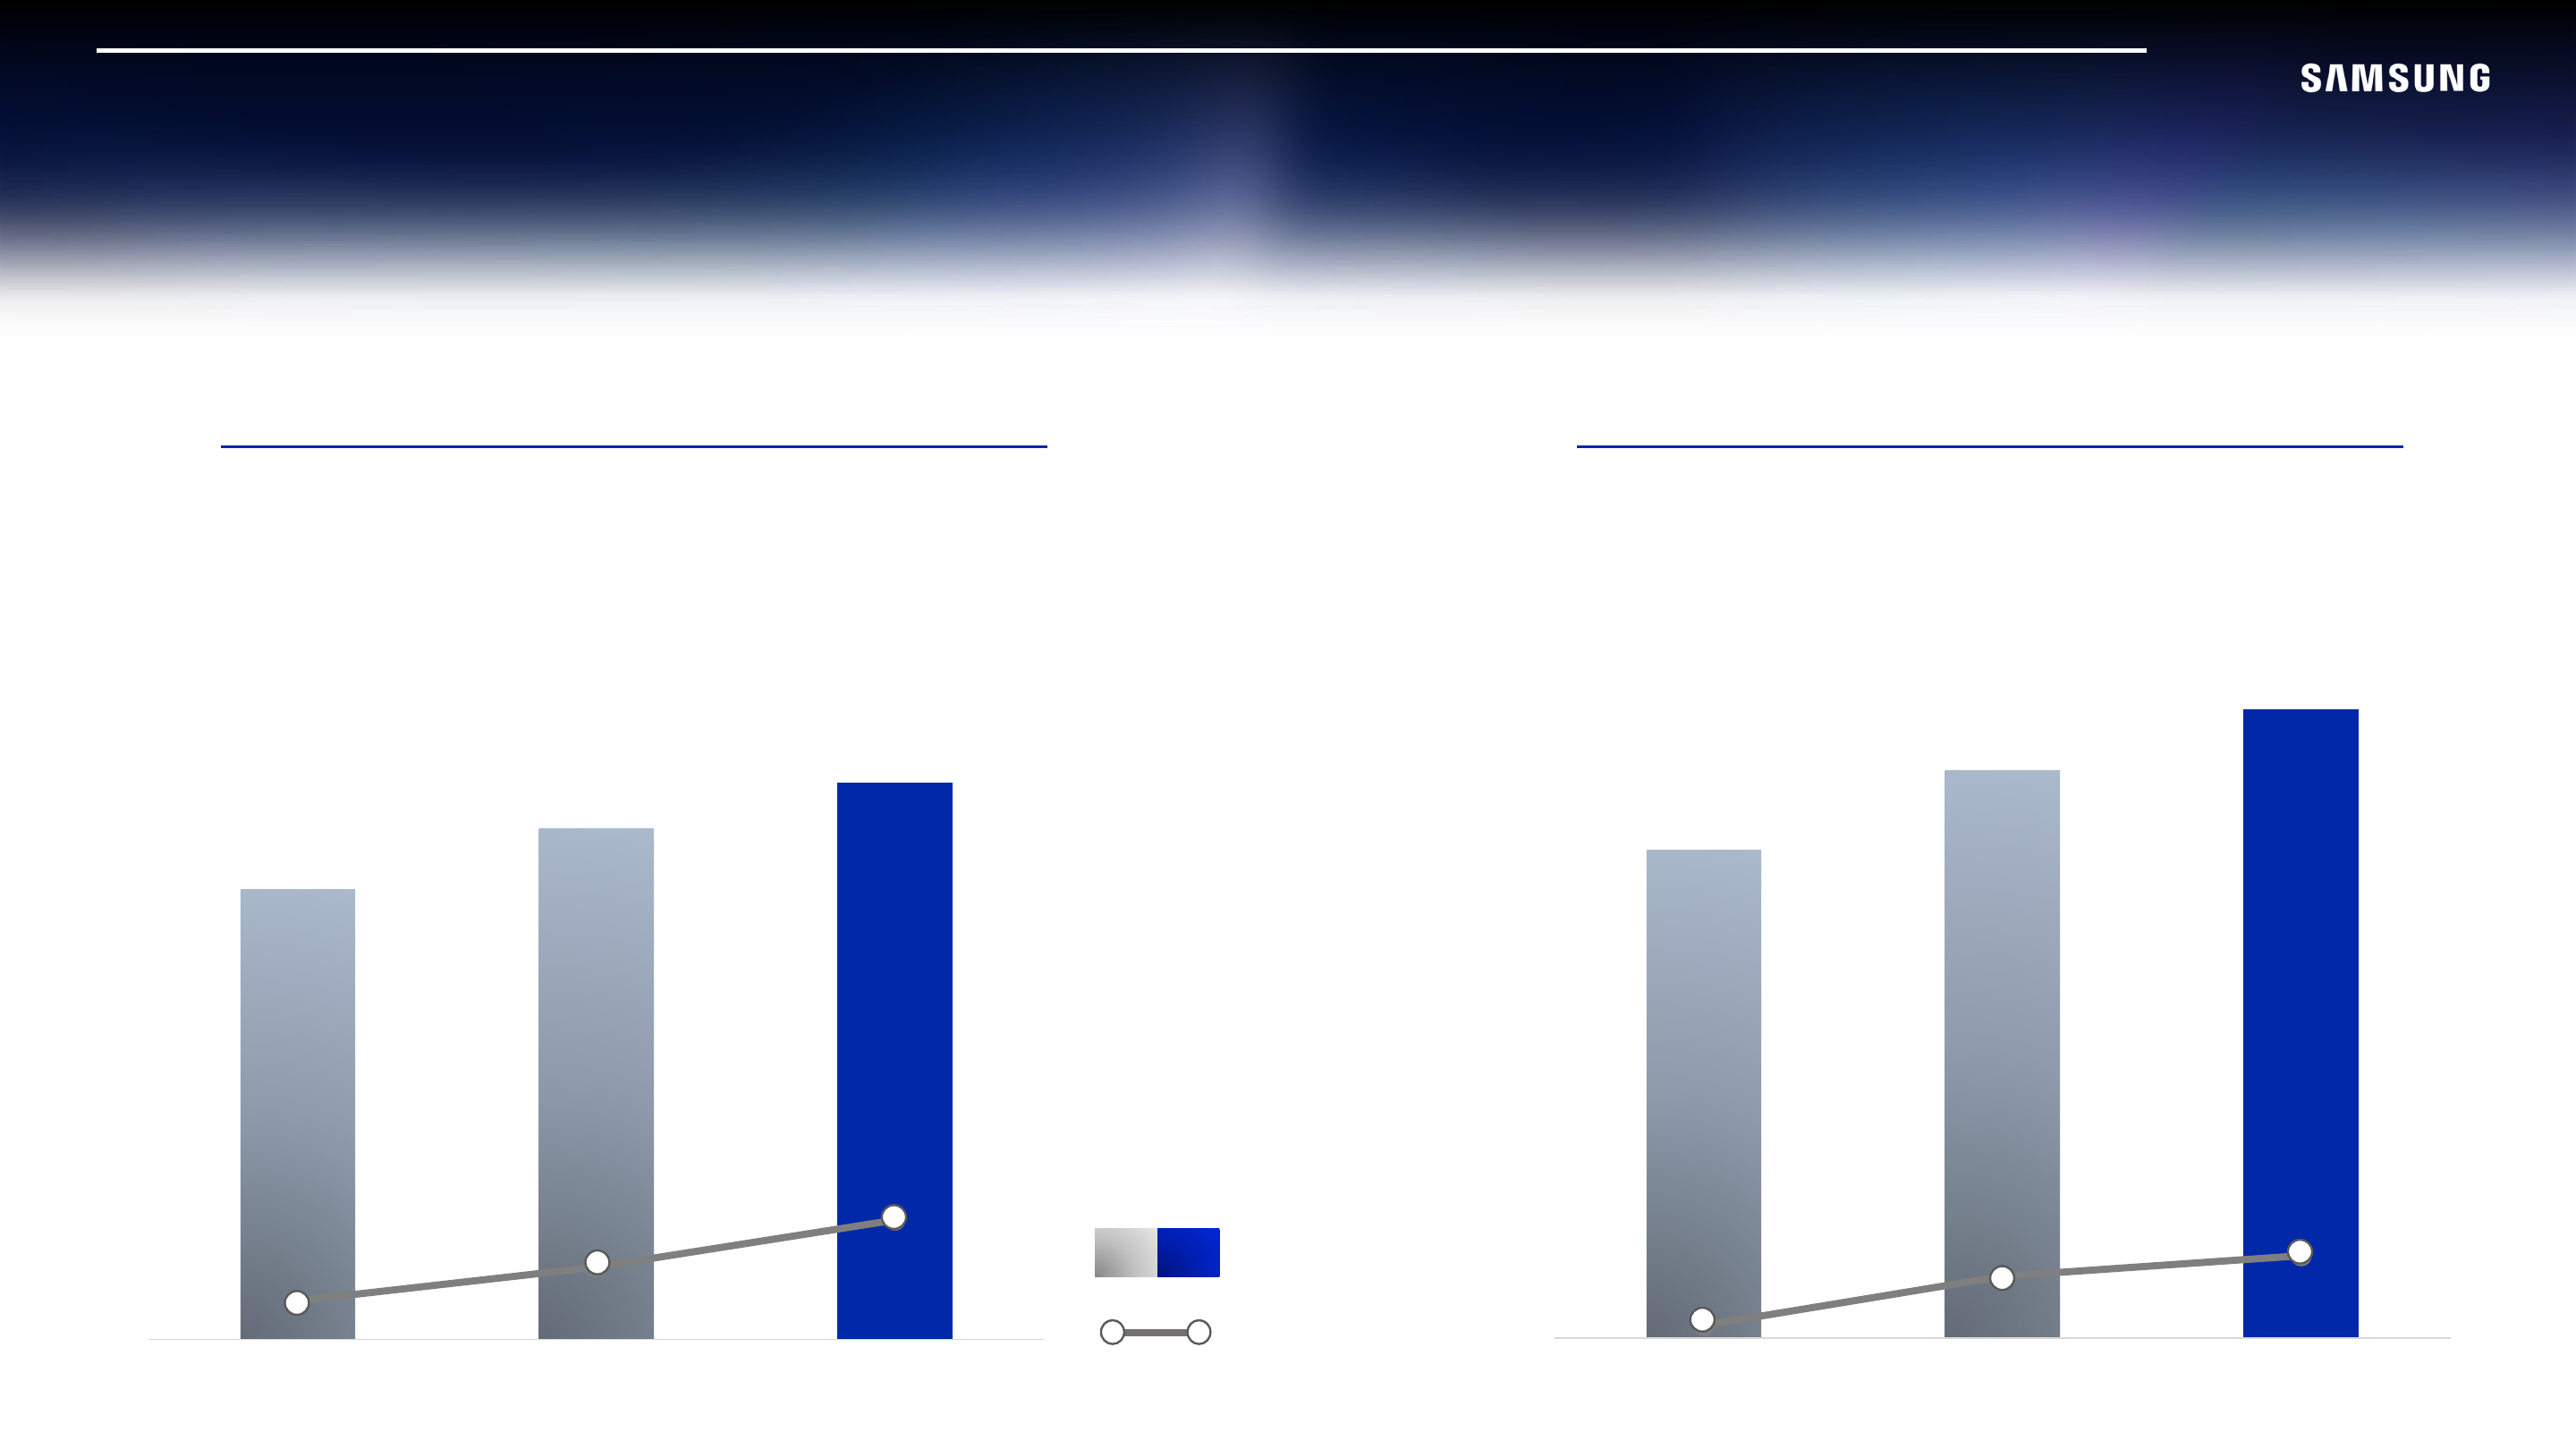
Quarterly Results
Sales: 93.8T | OP: 20.1T
Full-year Results
Sales: 333.6T | OP: 43.6T
| Period | Sales (KRW trillion) | OP (KRW trillion) |
|---|---|---|
| 4Q24 | 75.8 | 6.5 |
| 3Q25 | 86.1 | 12.2 |
| 4Q25 | 93.8 | 20.1 |
| Year | Sales (KRW trillion) | OP (KRW trillion) |
|---|---|---|
| 2023 | 258.9 | 6.6 |
| 2024 | 300.9 | 32.7 |
| 2025 | 333.6 | 43.6 |
4Q 2025 Results & Financial Data
Based on consolidated financial statements
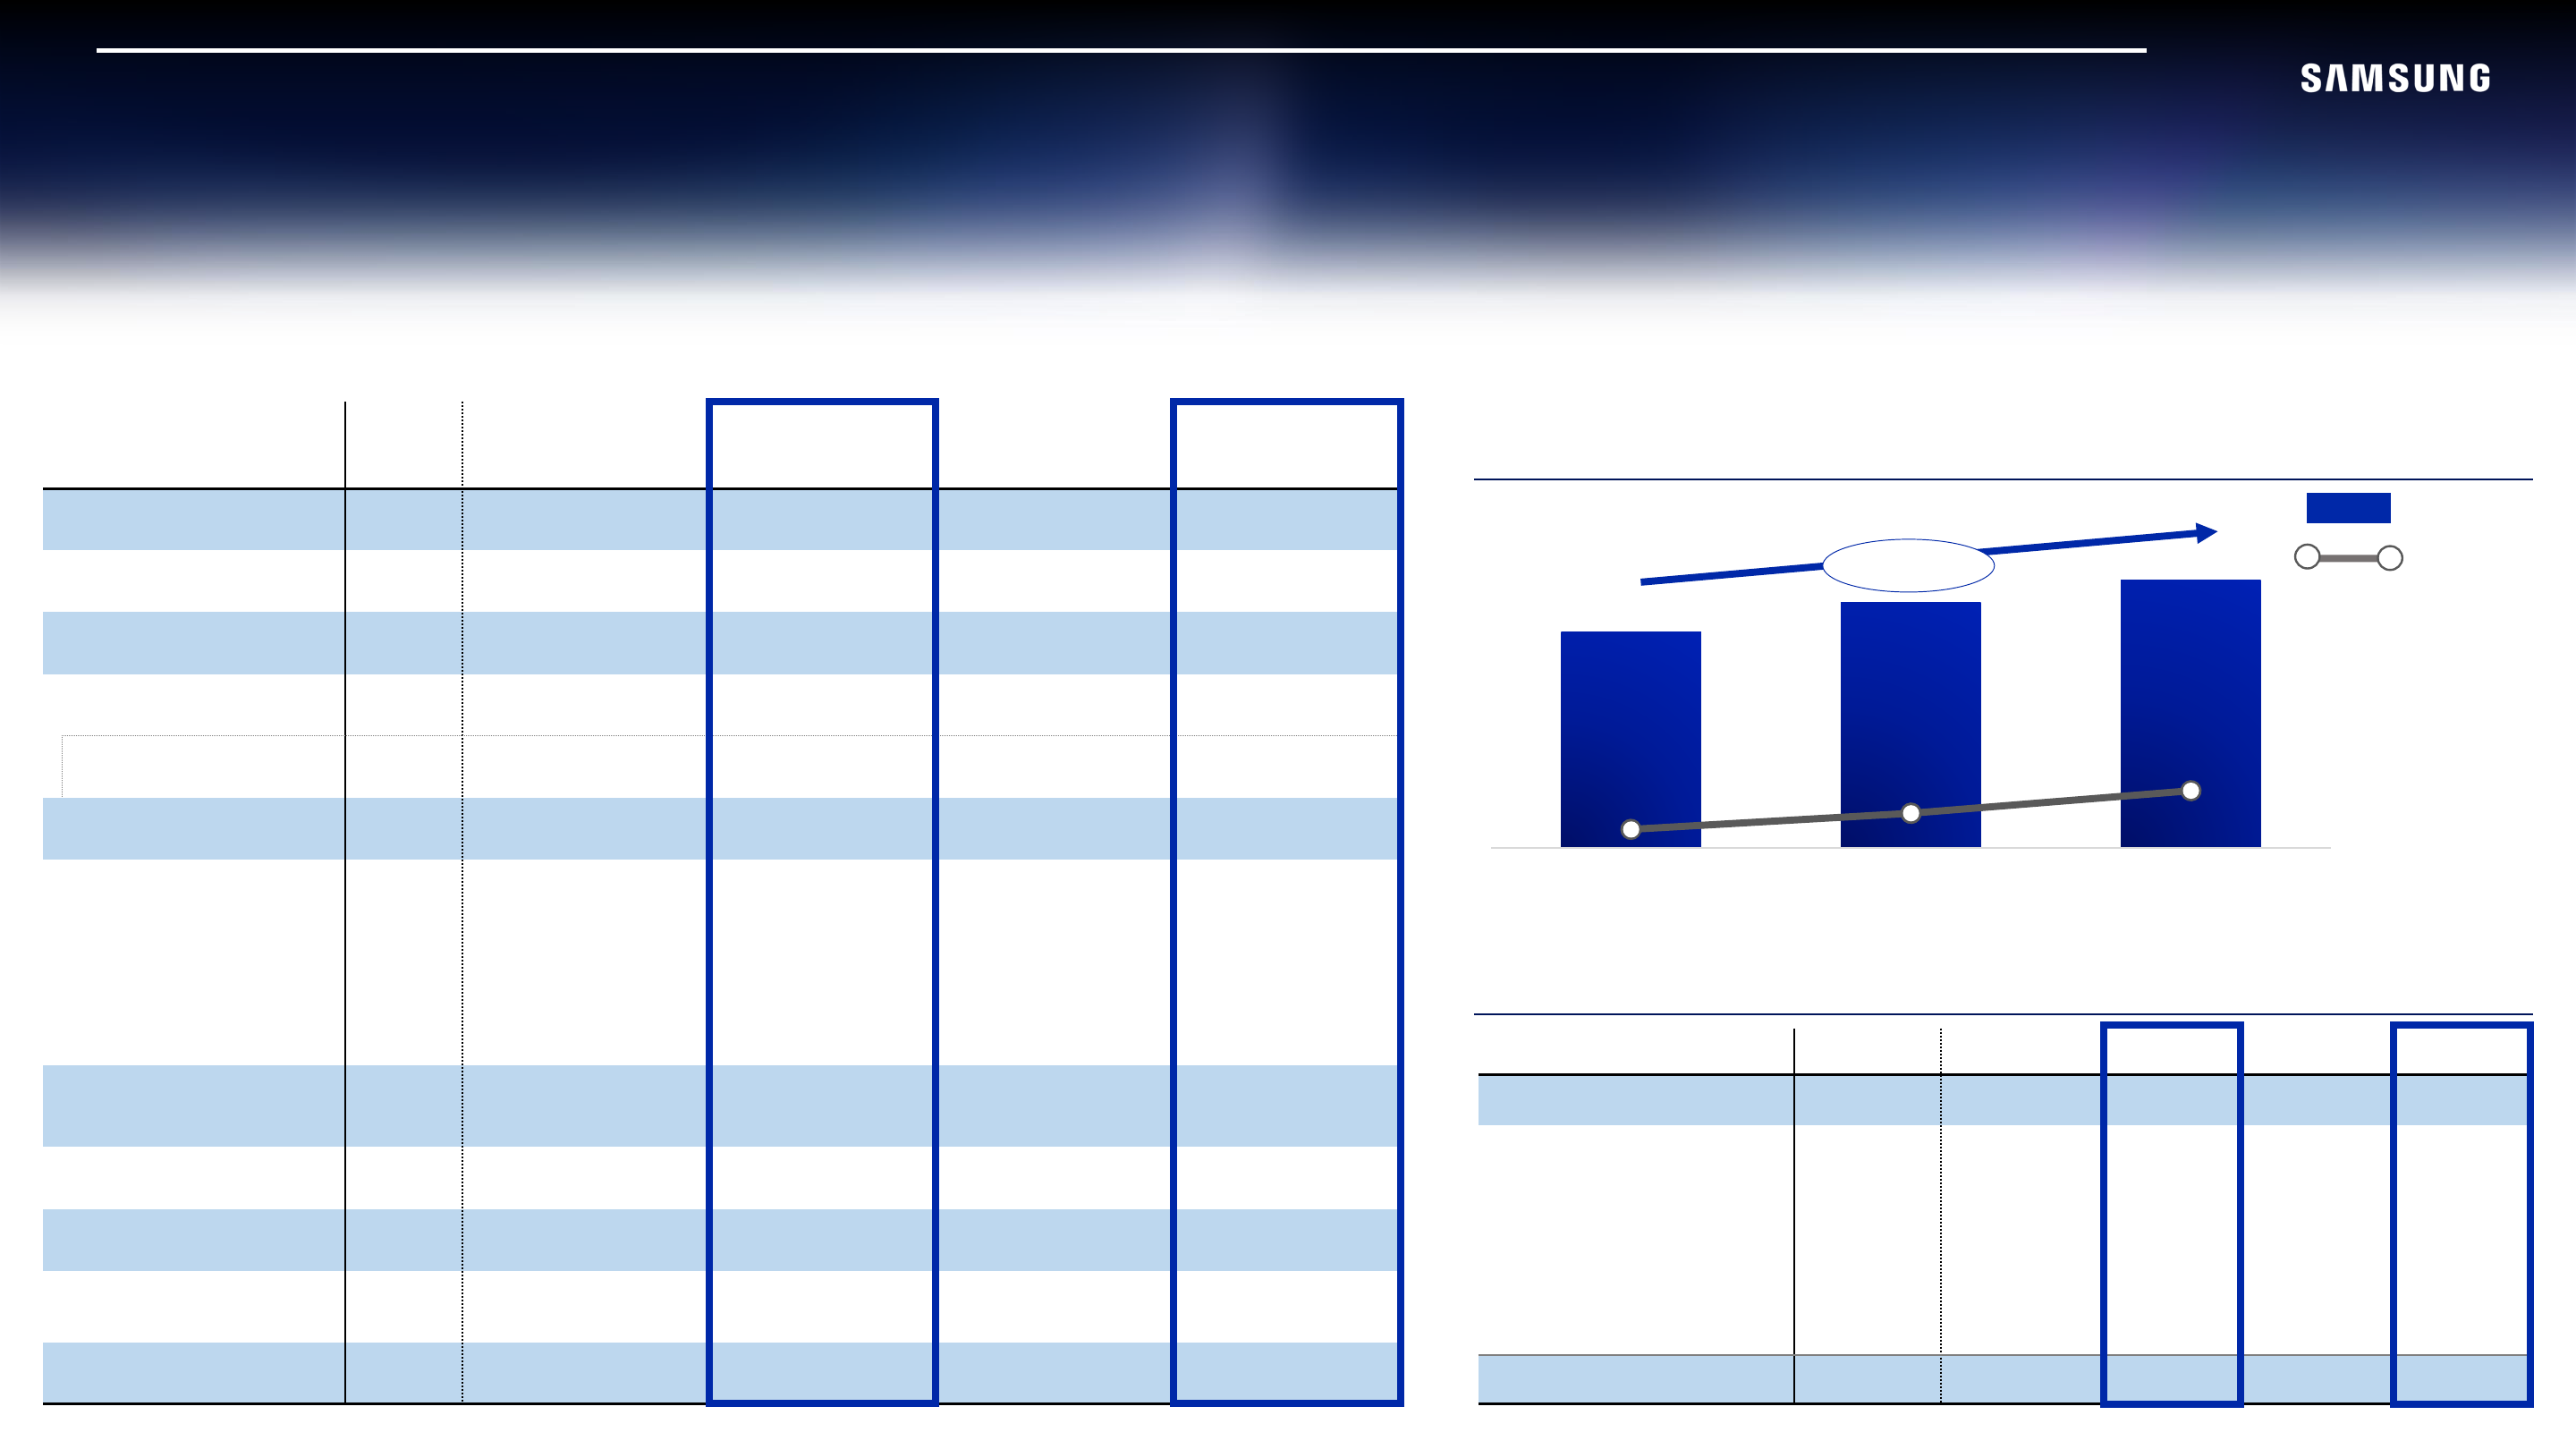
Sales and operating profit growth
24% YoY
| KRW trillion | 4Q24 | 3Q25 | % of sales | 4Q25 | % of sales | 2024 | % of sales | 2025 | % of sales |
|---|---|---|---|---|---|---|---|---|---|
| Sales | 75.8 | 86.1 | 100.0% | 93.8 | 100.0% | 300.9 | 100.0% | 333.6 | 100.0% |
| Cost of sales | 47.3 | 52.6 | 61.1% | 49.6 | 52.8% | 186.6 | 62.0% | 202.2 | 60.6% |
| Gross profit | 28.5 | 33.5 | 38.9% | 44.3 | 47.2% | 114.3 | 38.0% | 131.4 | 39.4% |
| SG&A expenses | 22.0 | 21.3 | 24.8% | 24.2 | 25.8% | 81.6 | 27.1% | 87.8 | 26.3% |
| R&D expenses | 10.3 | 8.8 | 10.3% | 10.9 | 11.6% | 35.0 | 11.6% | 37.7 | 11.3% |
| Operating profit | 6.5 | 12.2 | 14.1% | 20.1 | 21.4% | 32.7 | 10.9% | 43.6 | 13.1% |
| Other non-operating income/expenses | 0.04 | (0.1) | - | (0.1) | - | 0.3 | - | 0.7 | - |
| Equity method gain/loss | 0.2 | 0.3 | - | 0.1 | - | 0.8 | - | 0.7 | - |
| Finance income/expenses | 1.2 | 1.2 | - | 0.9 | - | 3.7 | - | 4.5 | - |
| Profit before income tax | 7.9 | 13.5 | 15.7% | 21.0 | 22.4% | 37.5 | 12.5% | 49.5 | 14.8% |
| Income tax | 0.2 | 1.3 | - | 1.4 | - | 3.1 | - | 4.3 | - |
| Net profit | 7.8 | 12.2 | 14.2% | 19.6 | 20.9% | 34.5 | 11.5% | 45.2 | 13.6% |
| Profit attributable to owners of the parent | 7.6 | 12.0 | 14.0% | 19.3 | 20.6% | 33.6 | 11.2% | 44.3 | 13.3% |
| EPS (KRW) ※ Common stock | 1,116 | 1,802 | 2,909 | 4,950 | 6,605 |
Key profitability indicators
| 4Q24 | 3Q25 | 4Q25 | 2024 | 2025 | |
|---|---|---|---|---|---|
| ROE | 8% | 12% | 19% | 9% | 11% |
| Profitability (net profit/sales) | 0.10 | 0.14 | 0.21 | 0.11 | 0.14 |
| Asset turnover (sales/asset) | 0.62 | 0.66 | 0.69 | 0.62 | 0.62 |
| Leverage (asset/equity) | 1.27 | 1.27 | 1.29 | 1.27 | 1.29 |
| EBITDA margin | 23% | 27% | 33% | 24% | 26% |
Results by Business Segment
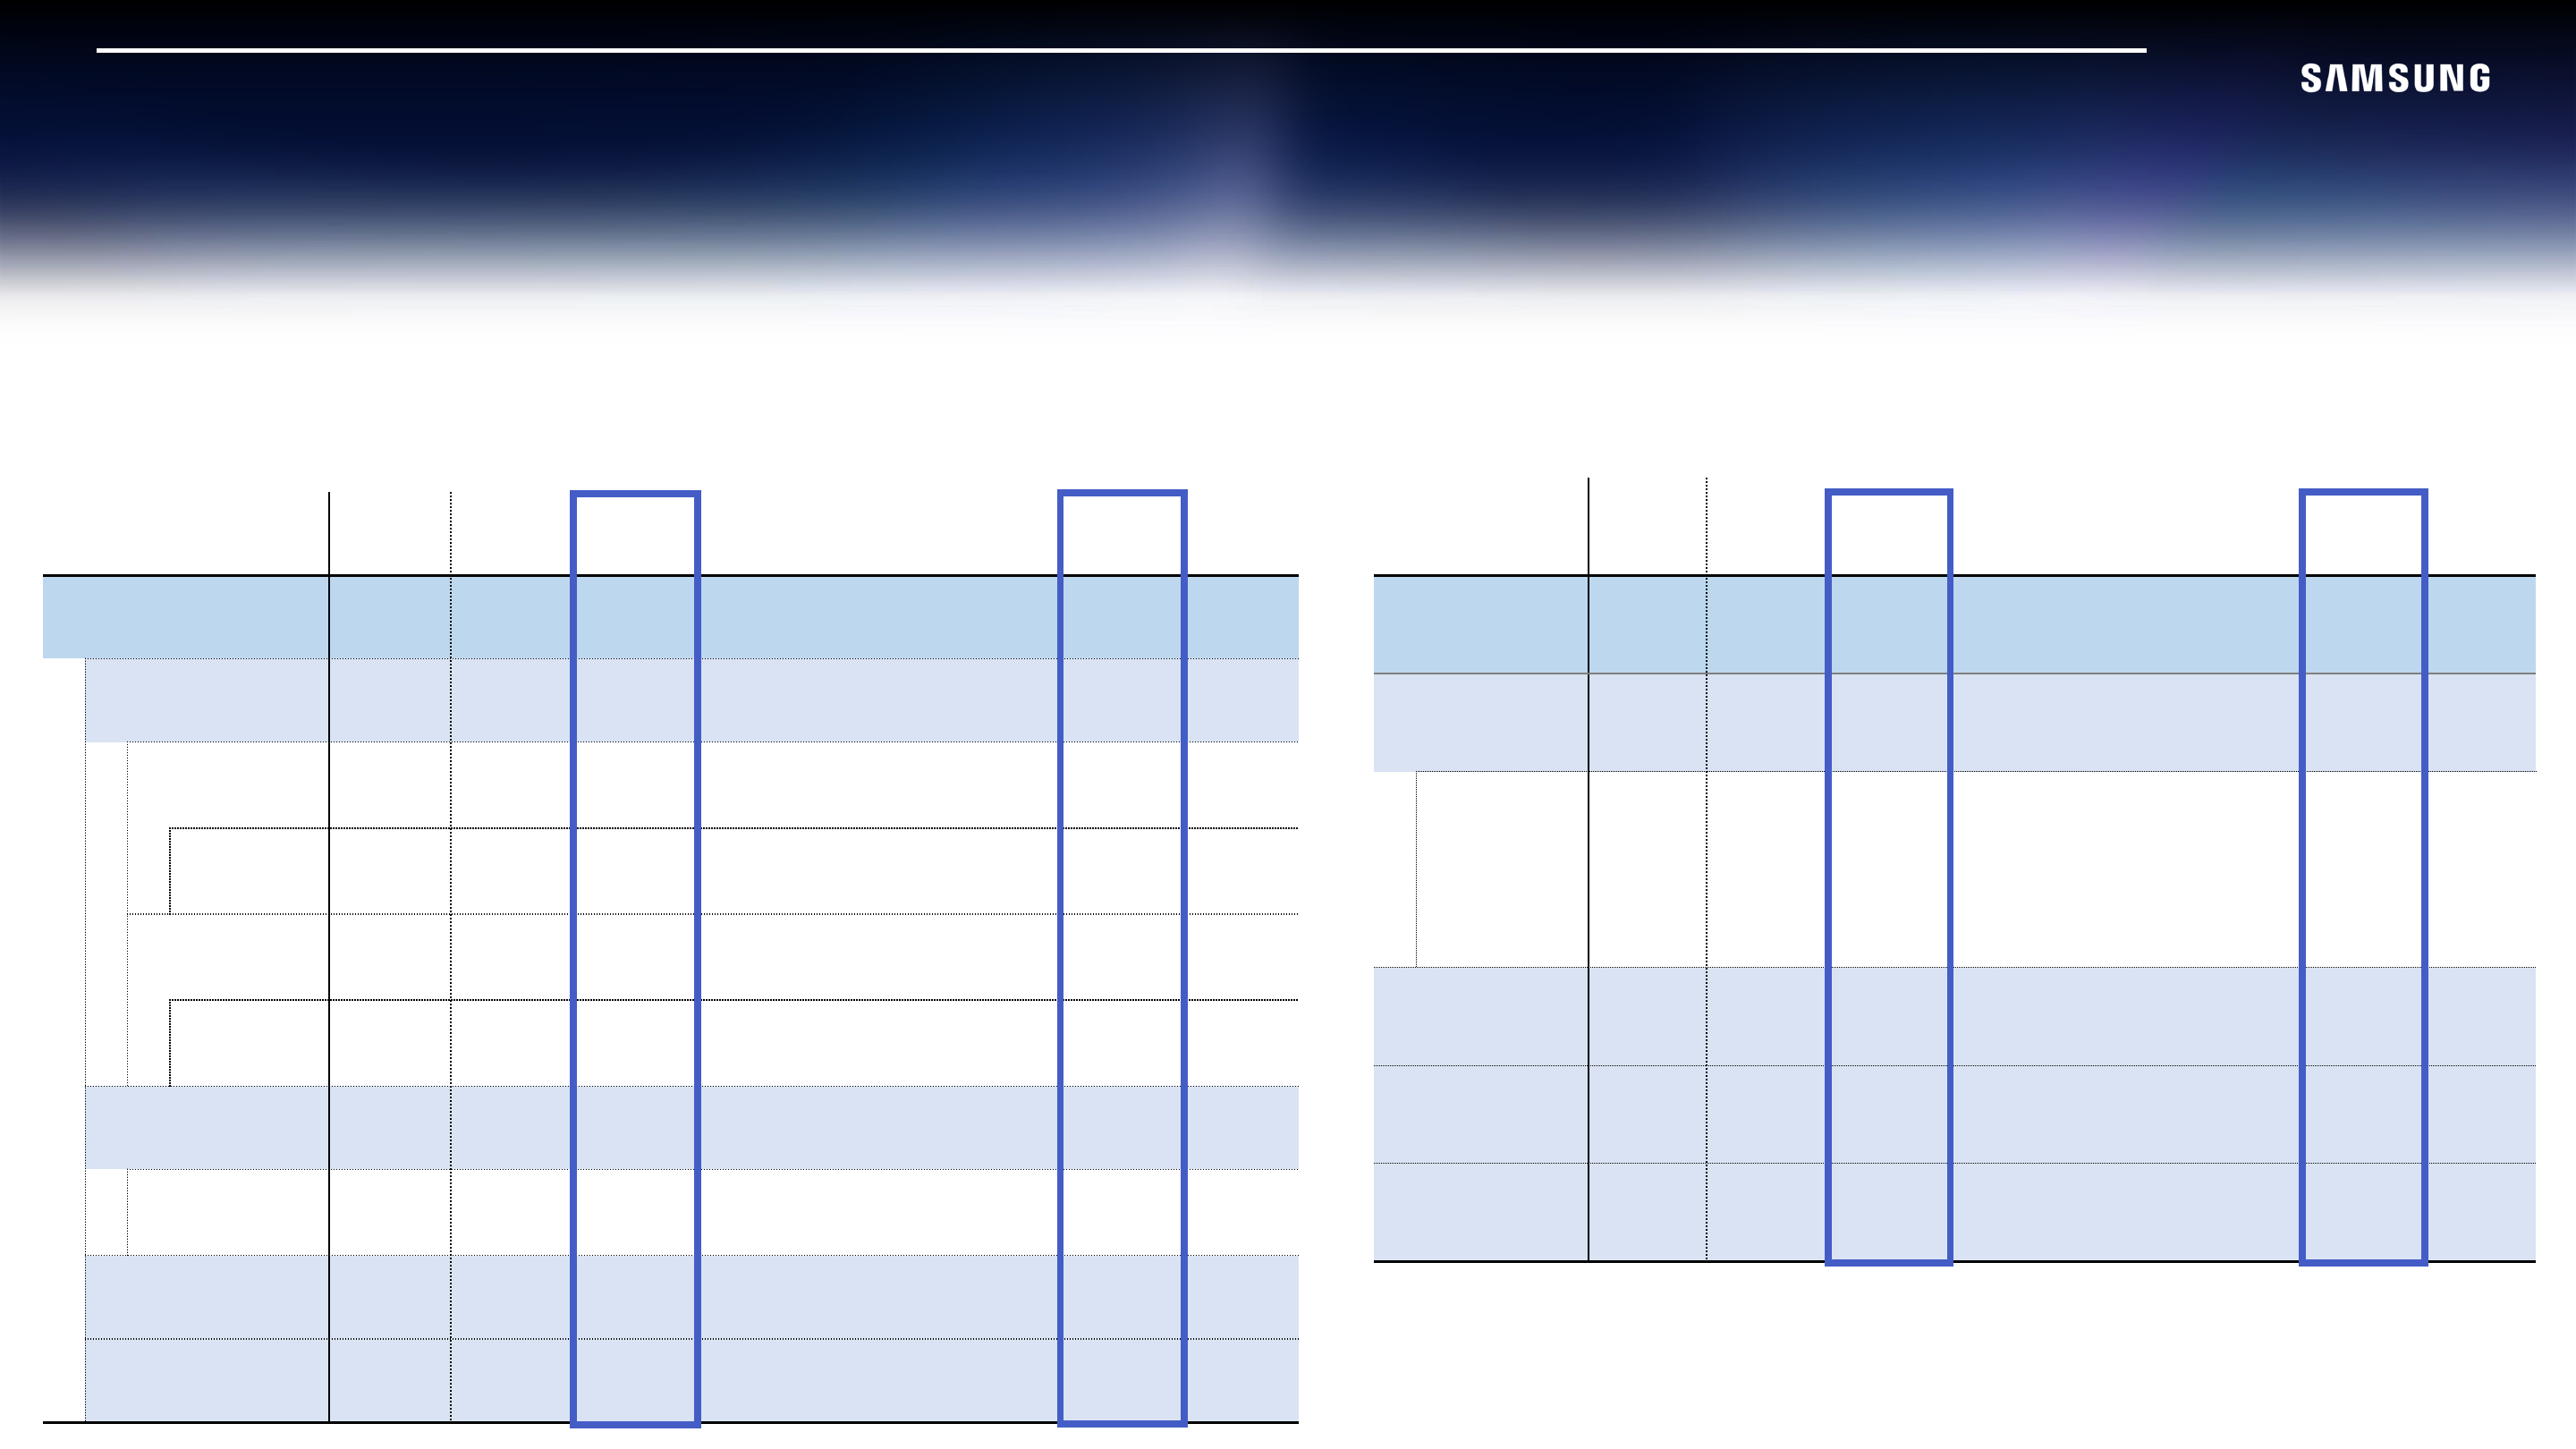
Sales
(KRW trillion)
| KRW trillion | 4Q24 | 3Q25 | 4Q25 | QoQ | YoY | 2024 | 2025 | YoY |
|---|---|---|---|---|---|---|---|---|
| Total | 75.8 | 86.1 | 93.8 | 9%↑ | 24%↑ | 300.9 | 333.6 | 11%↑ |
| DX | 40.5 | 48.4 | 44.3 | 8%↓ | 9%↑ | 174.9 | 188.0 | 7%↑ |
| MX / NW | 25.8 | 34.1 | 29.3 | 14%↓ | 13%↑ | 117.3 | 129.5 | 10%↑ |
| MX | 25.0 | 33.5 | 28.3 | 16%↓ | 13%↑ | 114.4 | 126.5 | 11%↑ |
| VD / DA | 14.4 | 13.9 | 14.8 | 6%↑ | 2%↑ | 56.5 | 57.3 | 1%↑ |
| VD | 8.6 | 7.3 | 8.8 | 20%↑ | 2%↑ | 30.9 | 30.9 | 0.2%↓ |
| DS | 30.1 | 33.1 | 44.0 | 33%↑ | 46%↑ | 111.1 | 130.1 | 17%↑ |
| Memory | 23.0 | 26.7 | 37.1 | 39%↑ | 62%↑ | 84.5 | 104.1 | 23%↑ |
| SDC | 8.1 | 8.1 | 9.5 | 17%↑ | 17%↑ | 29.2 | 29.8 | 2%↑ |
| Harman | 3.9 | 4.0 | 4.6 | 16%↑ | 17%↑ | 14.3 | 15.8 | 11%↑ |
Operating profit
(KRW trillion)
| KRW trillion | 4Q24 | 3Q25 | 4Q25 | QoQ | YoY | 2024 | 2025 | YoY |
|---|---|---|---|---|---|---|---|---|
| Total | 6.5 | 12.2 | 20.1 | 7.9↑ | 13.6↑ | 32.7 | 43.6 | 10.9↑ |
| DX | 2.3 | 3.5 | 1.3 | 2.1↓ | 0.9↓ | 12.4 | 12.9 | 0.4↑ |
| MX / NW | 2.1 | 3.6 | 1.9 | 1.6↓ | 0.2↓ | 10.6 | 12.9 | 2.2↑ |
| VD / DA | 0.2 | (0.1) | (0.6) | 0.5↓ | 0.8↓ | 1.7 | (0.2) | 1.9↓ |
| DS | 2.9 | 7.0 | 16.4 | 9.4↑ | 13.5↑ | 15.1 | 24.9 | 9.8↑ |
| SDC | 0.9 | 1.2 | 2.0 | 0.7↑ | 1.1↑ | 3.7 | 4.1 | 0.4↑ |
| Harman | 0.4 | 0.4 | 0.3 | 0.1↓ | 0.1↓ | 1.3 | 1.5 | 0.2↑ |
※ Sales and operating profit of each business stated above reflect the organizational structure as of December 2021 and the sales of business units include intersegment sales. ※ The DX Division provides earnings call materials based on the business structure before the reorganization to prevent confusion and to improve understanding among investors. ※ DX: Device eXperience MX: Mobile eXperience DS: Device Solutions ※ Sales and operating profit of VD/DA include the results of Health & Medical Equipment business. ※ Harman's sales and operating profit figures are based on Samsung Electronics' fiscal year and acquisition related expenses are reflected.
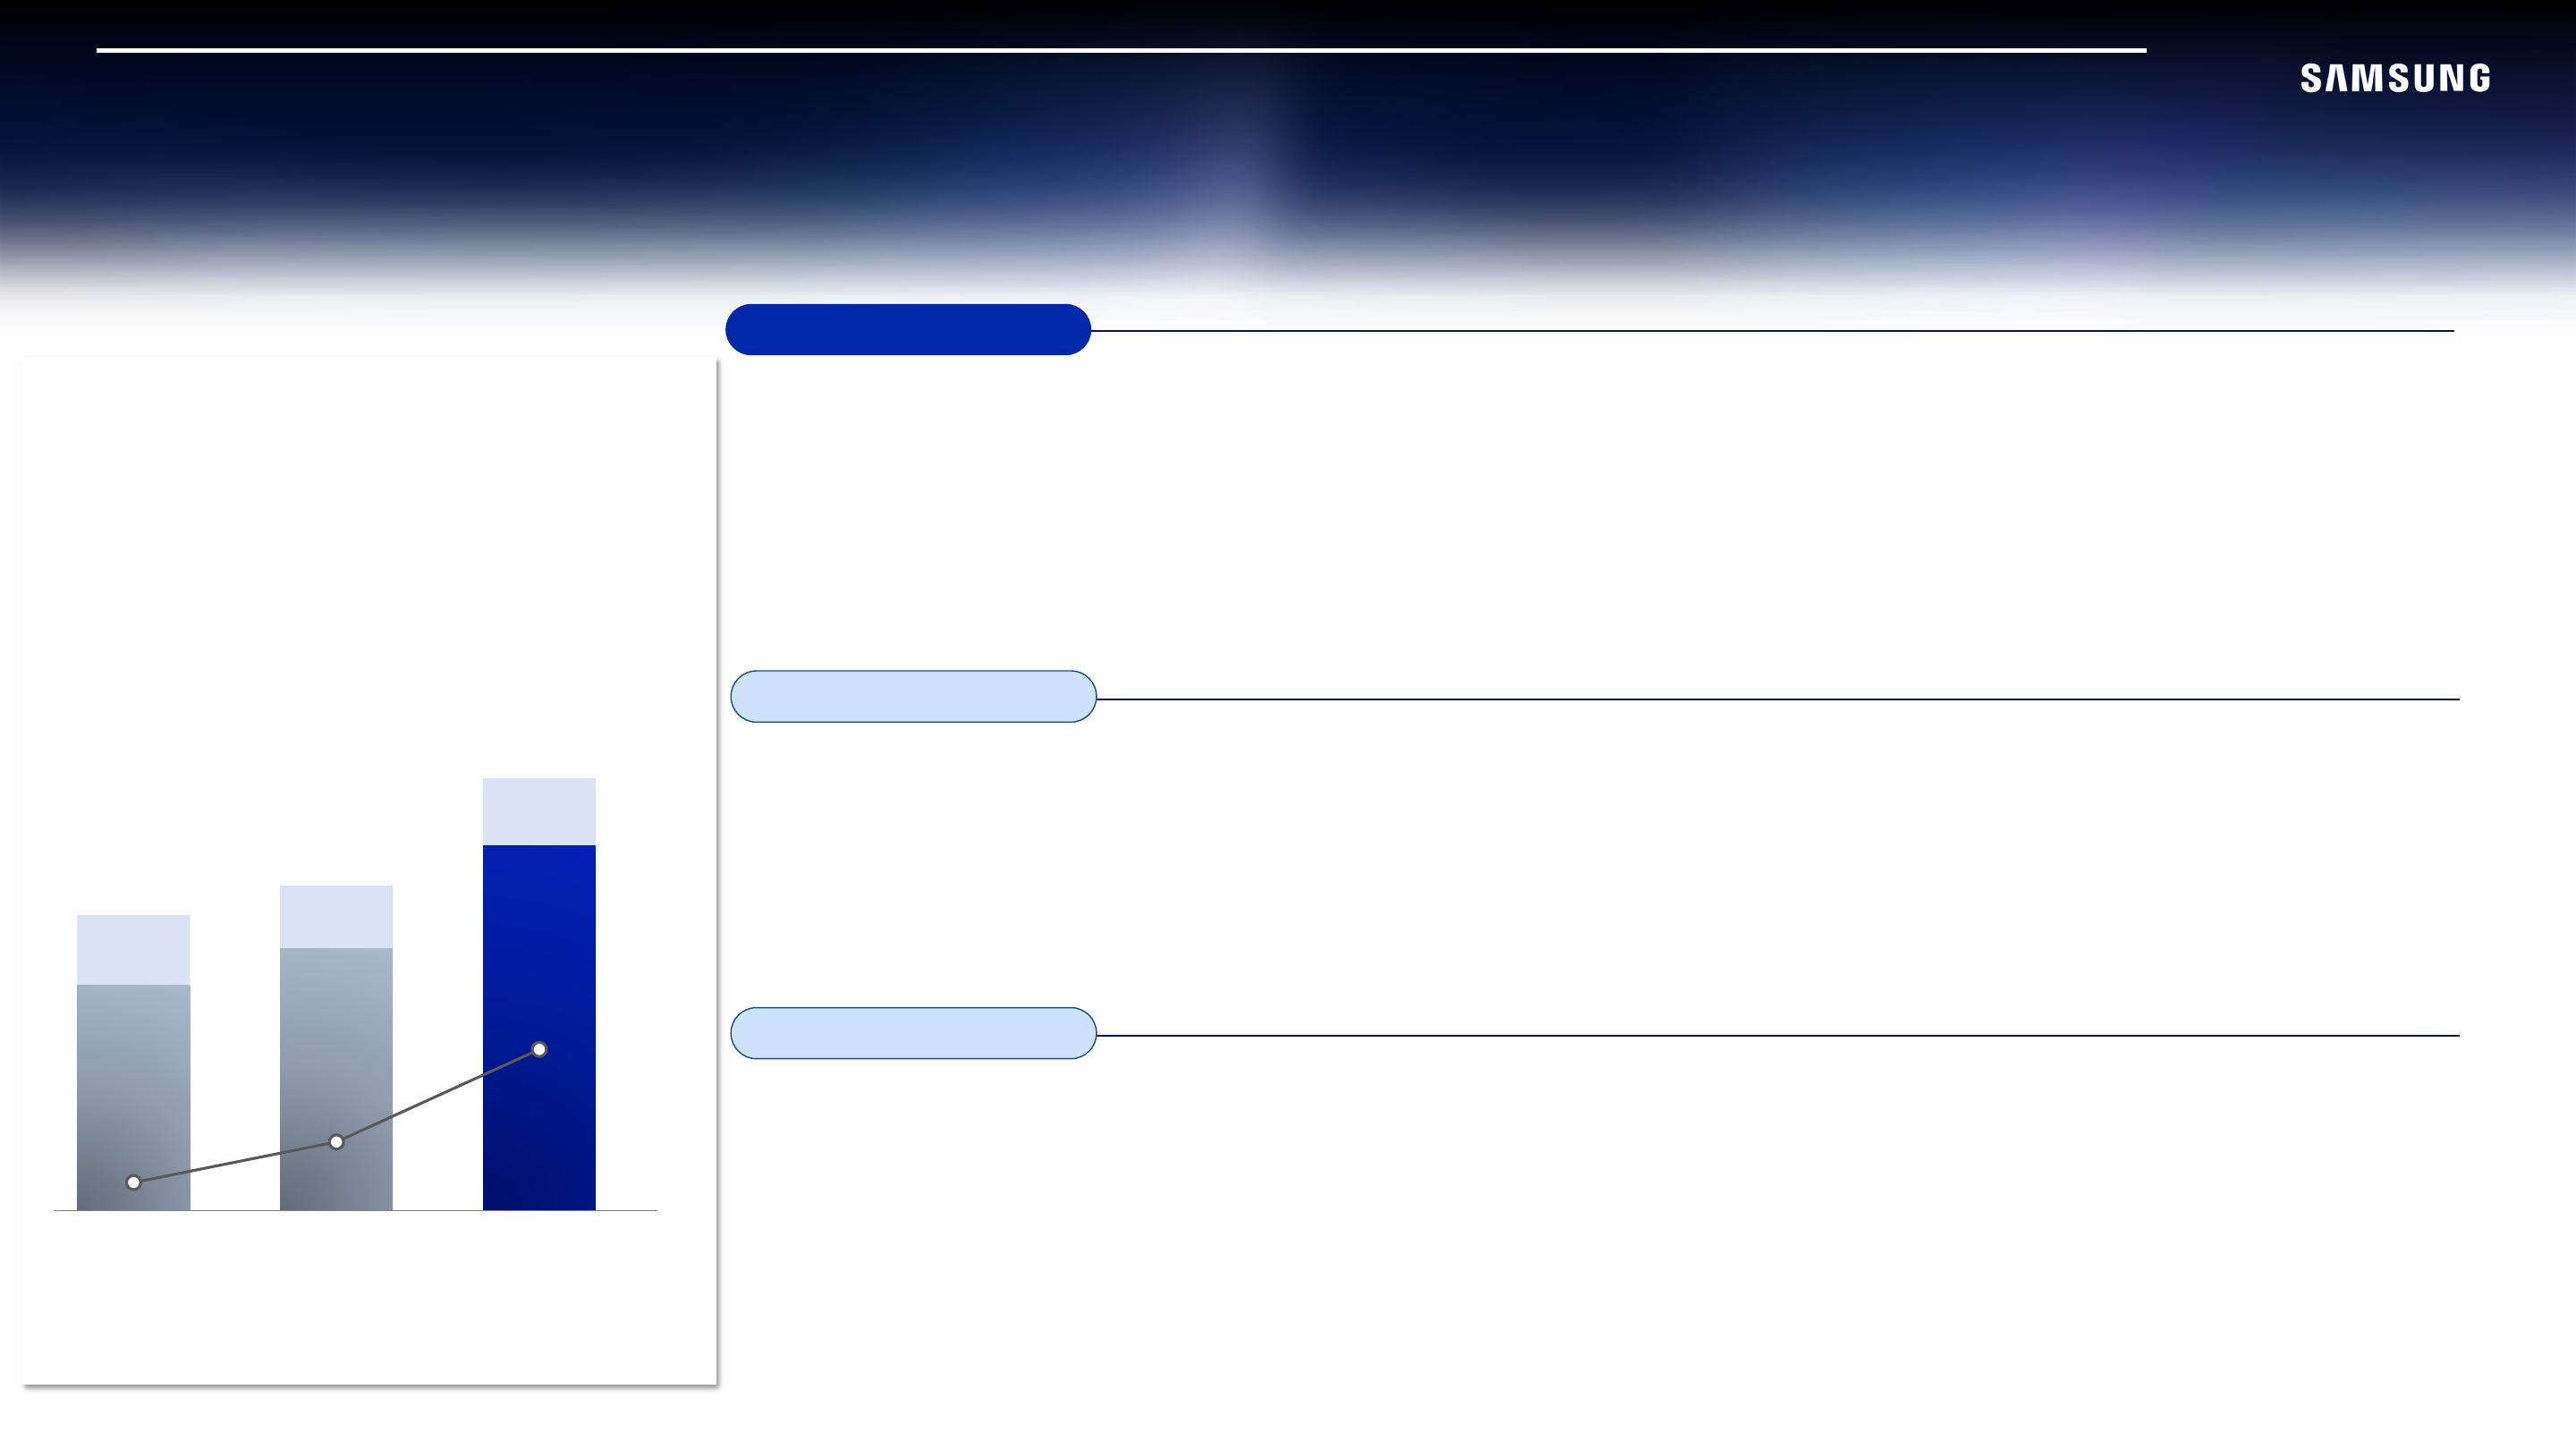
Memory
DS results
(KRW trillion)
| 4Q24 | 3Q25 | 4Q25 | |
|---|---|---|---|
| Sales (DS) | 30.1 | 33.1 | 44.0 |
| Sales (Mem) | 23.0 | 26.7 | 37.1 |
| OP (DS) | 2.9 | 7.0 | 16.4 |
4Q 2025 Results
Achieved Record-High Quarterly Revenue and Operating Profit
- Addressed strong conventional DRAM demand while expanding HBM sales despite limited supply availability
- Overall price increase further widened the upward sales trend
Concentrated on Profit Improvement
- Enhanced profitability via higher sales of high-value-added products such as HBM, Server DDR5, and Enterprise SSD
1Q 2026 Outlook
Continue Prioritizing High-Value-Added Products for AI Applications
- Continued AI boom is expected to drive favorable market conditions across the industry
Pave the Way for Leading High-End HBM Market
- Plan to start delivering HBM4 mass products, including the industry-leading 11.7Gbps SKU
2026 Outlook
Lead the AI Era in Close Partnership with Customers based on Product Competitiveness
- Aim to address customers' demand by timely shipment of competitive HBM4
- Plan to continue expanding AI-related product sales with high-density DDR5, SOCAMM2, GDDR7, etc.
Proactively Address AI-related NAND Demand
- Focus on scaling up high-performance TLC SSD sales for AI KV(Key-Value) SSD demand
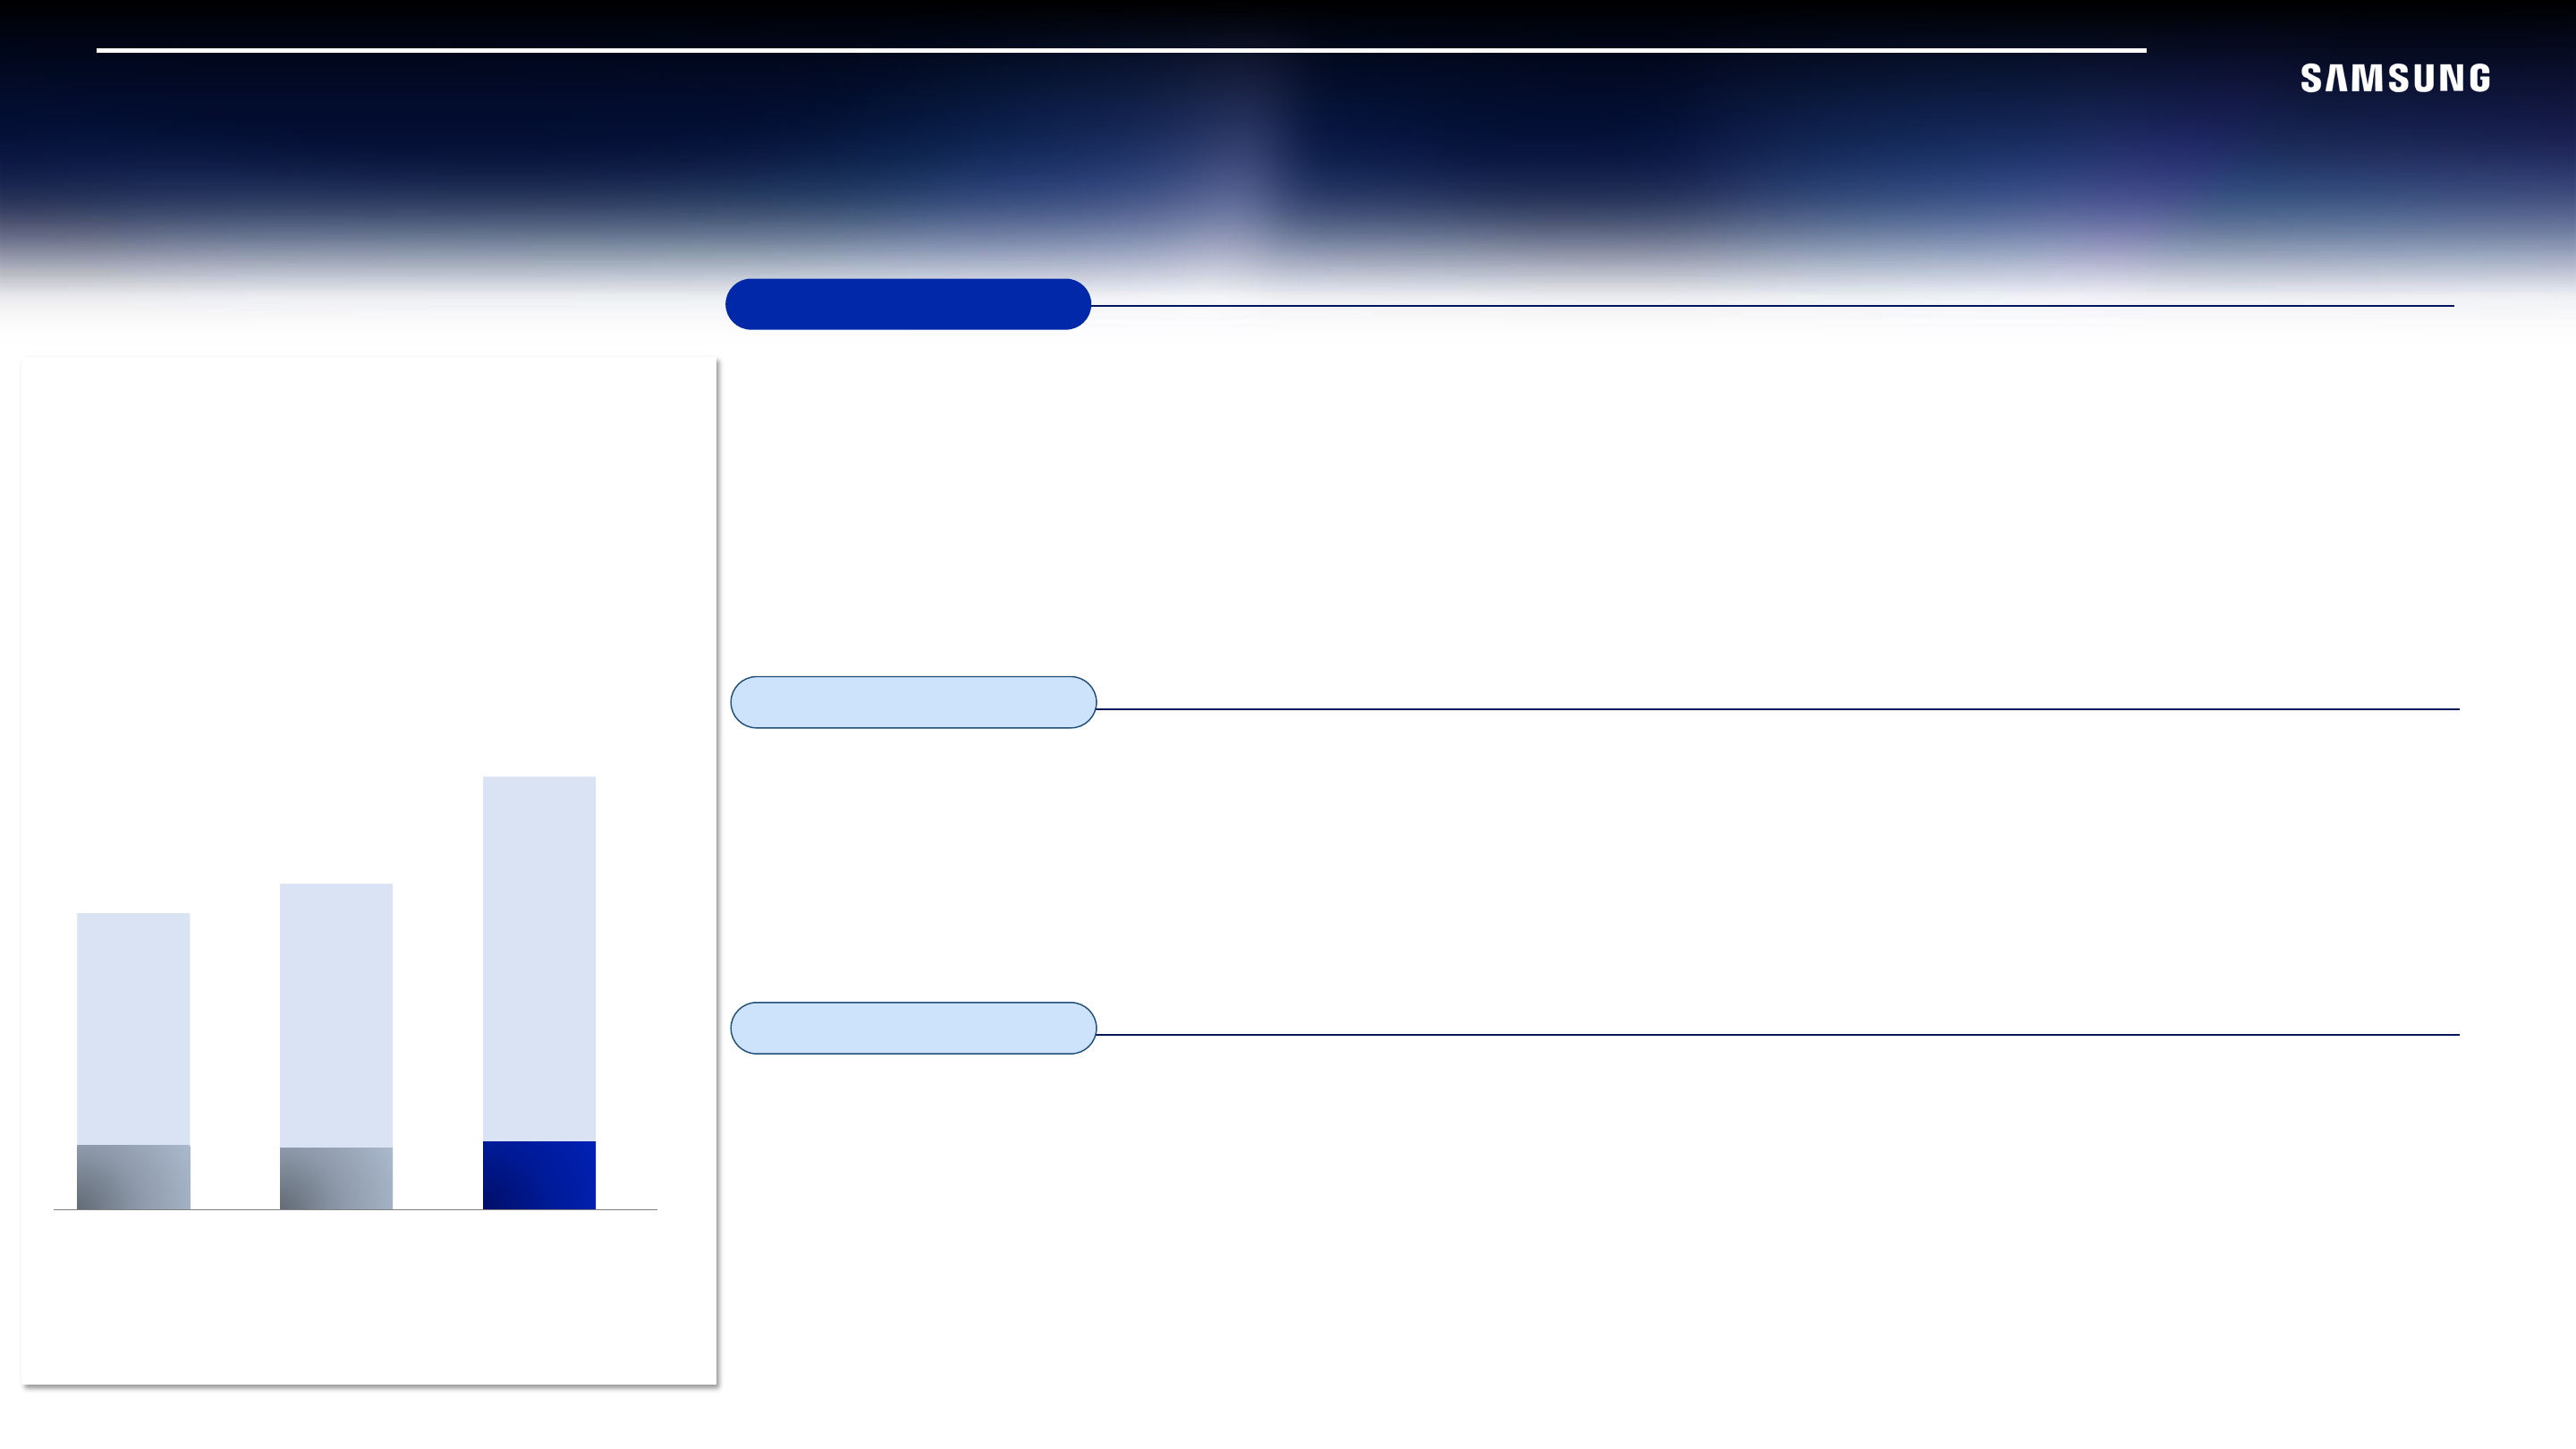
S.LSI / Foundry
DS results
(KRW trillion)
| 4Q24 | 3Q25 | 4Q25 | |
|---|---|---|---|
| Sales (DS) | 30.1 | 33.1 | 44.0 |
4Q 2025 Results
S.LSI
- Earnings declined due to seasonal demand softness and adjustments in schedules for key customer products
- Image sensor revenue grew on the back of new 200Mp and 50Mp big-pixel products
Foundry
- Commenced mass production of 1st Gen. 2nm products and initial shipments of 4nm HBM base-die
- Revenue increased on strong U.S. and China demand, while earnings improvement was limited due to provisioning costs
1Q 2026 Outlook
S.LSI
- SoC revenue recovery is expected with new product launches, while sensor leadership is reinforced through an expanded 200Mp lineup
Foundry
- Revenue is expected to decline sequentially due to seasonal weakness
- Orders continue to expand, led by HPC/mobile customers
2026 Outlook
S.LSI
- Focus on earnings improvement by expanding design wins based on differentiated SoC performance and stabilized yields
- Image sensors will drive demand growth through an expanded 200Mp portfolio
Foundry
- Target double-digit revenue growth and profitability improvement, driven by advanced nodes
- Ramp up 2nd Gen. 2nm and prepare performance and power-optimized 4nm process
- Provide optimized solutions through logic, memory and advanced packaging integration
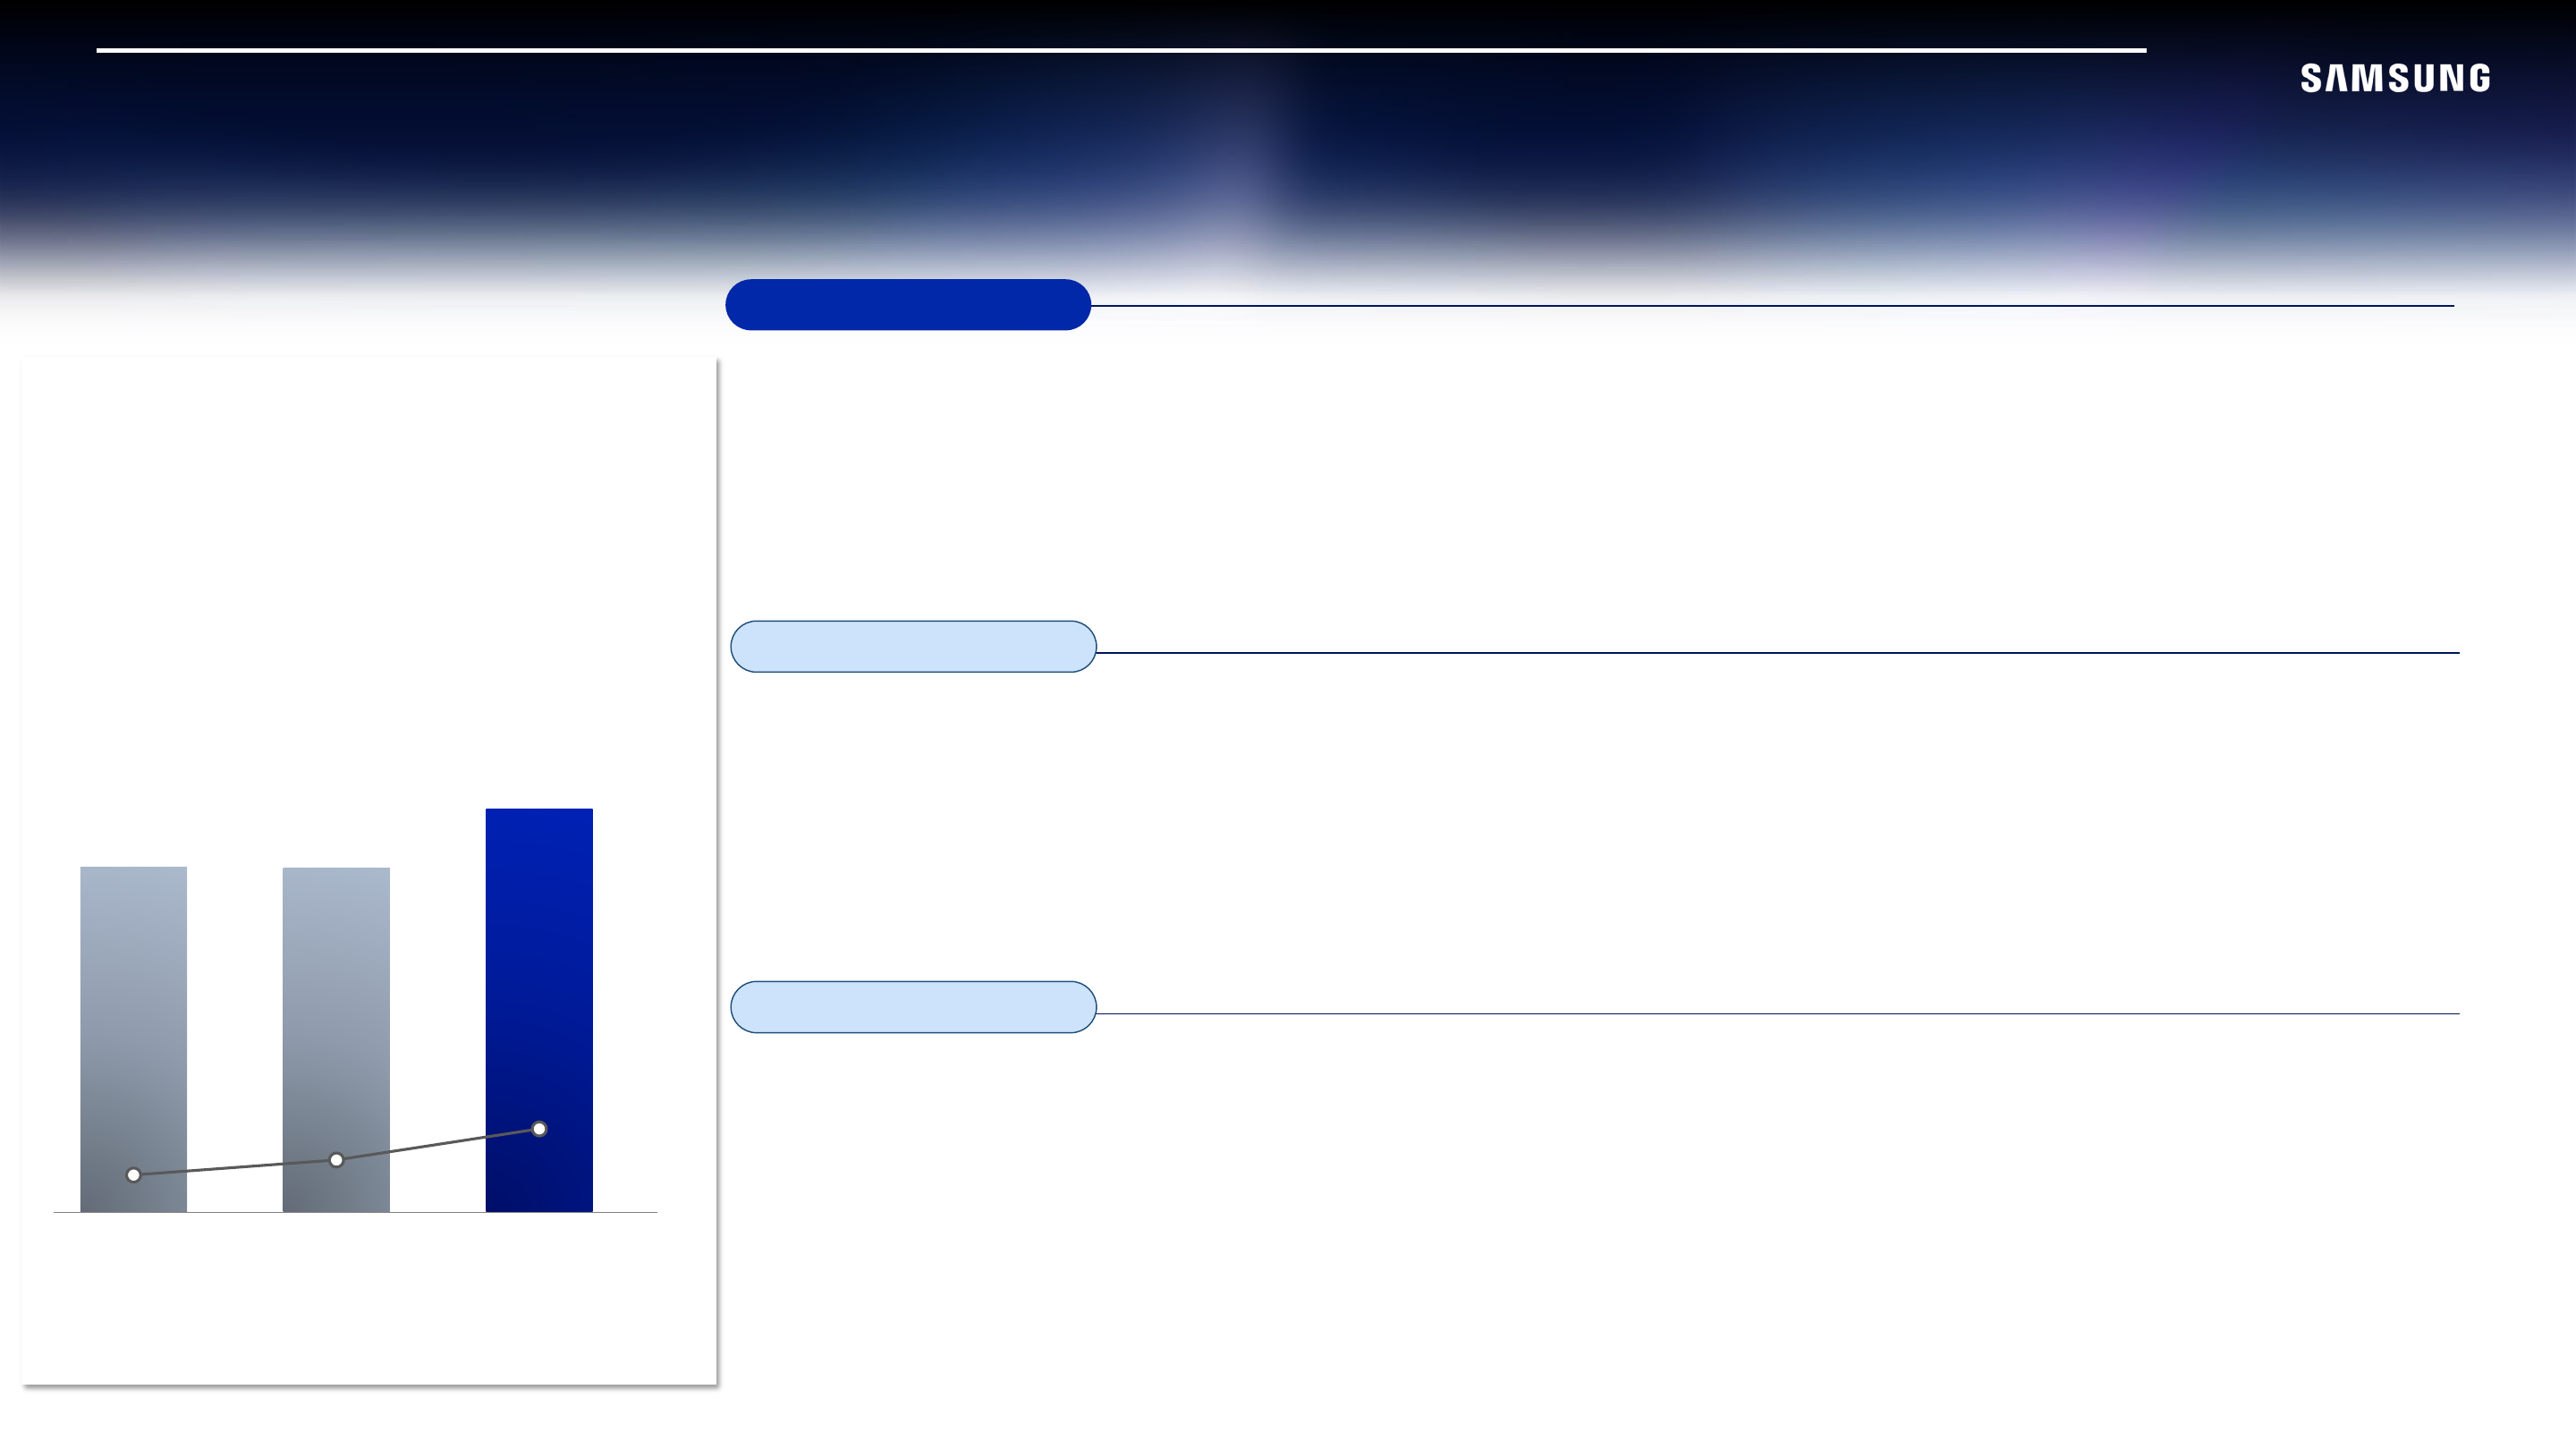
SDC (Samsung Display Corporation)
SDC results
(KRW trillion)
| 4Q24 | 3Q25 | 4Q25 | |
|---|---|---|---|
| Sales | 8.1 | 8.1 | 9.5 |
| OP | 0.9 | 1.2 | 2.0 |
4Q 2025 Results
Small & Medium
- Achieved solid performance driven by increased smartphone demand from major customers and supply stability
- Sales expansion in IT and Automotive segments also contributed to earnings growth
Large
- Recorded revenue growth by responding to market demand during the year-end peak season
1Q 2026 Outlook
Small & Medium
- Anticipate weak smartphone demand due to seasonality and memory supply and price impacts
- Seek to expand sales through timely development and supply of new major flagship smartphones
Large
- Proactively respond to the launch of new QD-OLED products and aim to expand sales
2026 Outlook
Small & Medium
- Expect increased price pressure on display due to rising memory price
- Plan to maintain leadership in the smartphone market based on differentiated technologies
Large
- TVs: Maintain premium market leadership by focusing on new high-brightness products
- Monitors: Drive sales expansion based on differentiated performance advantages
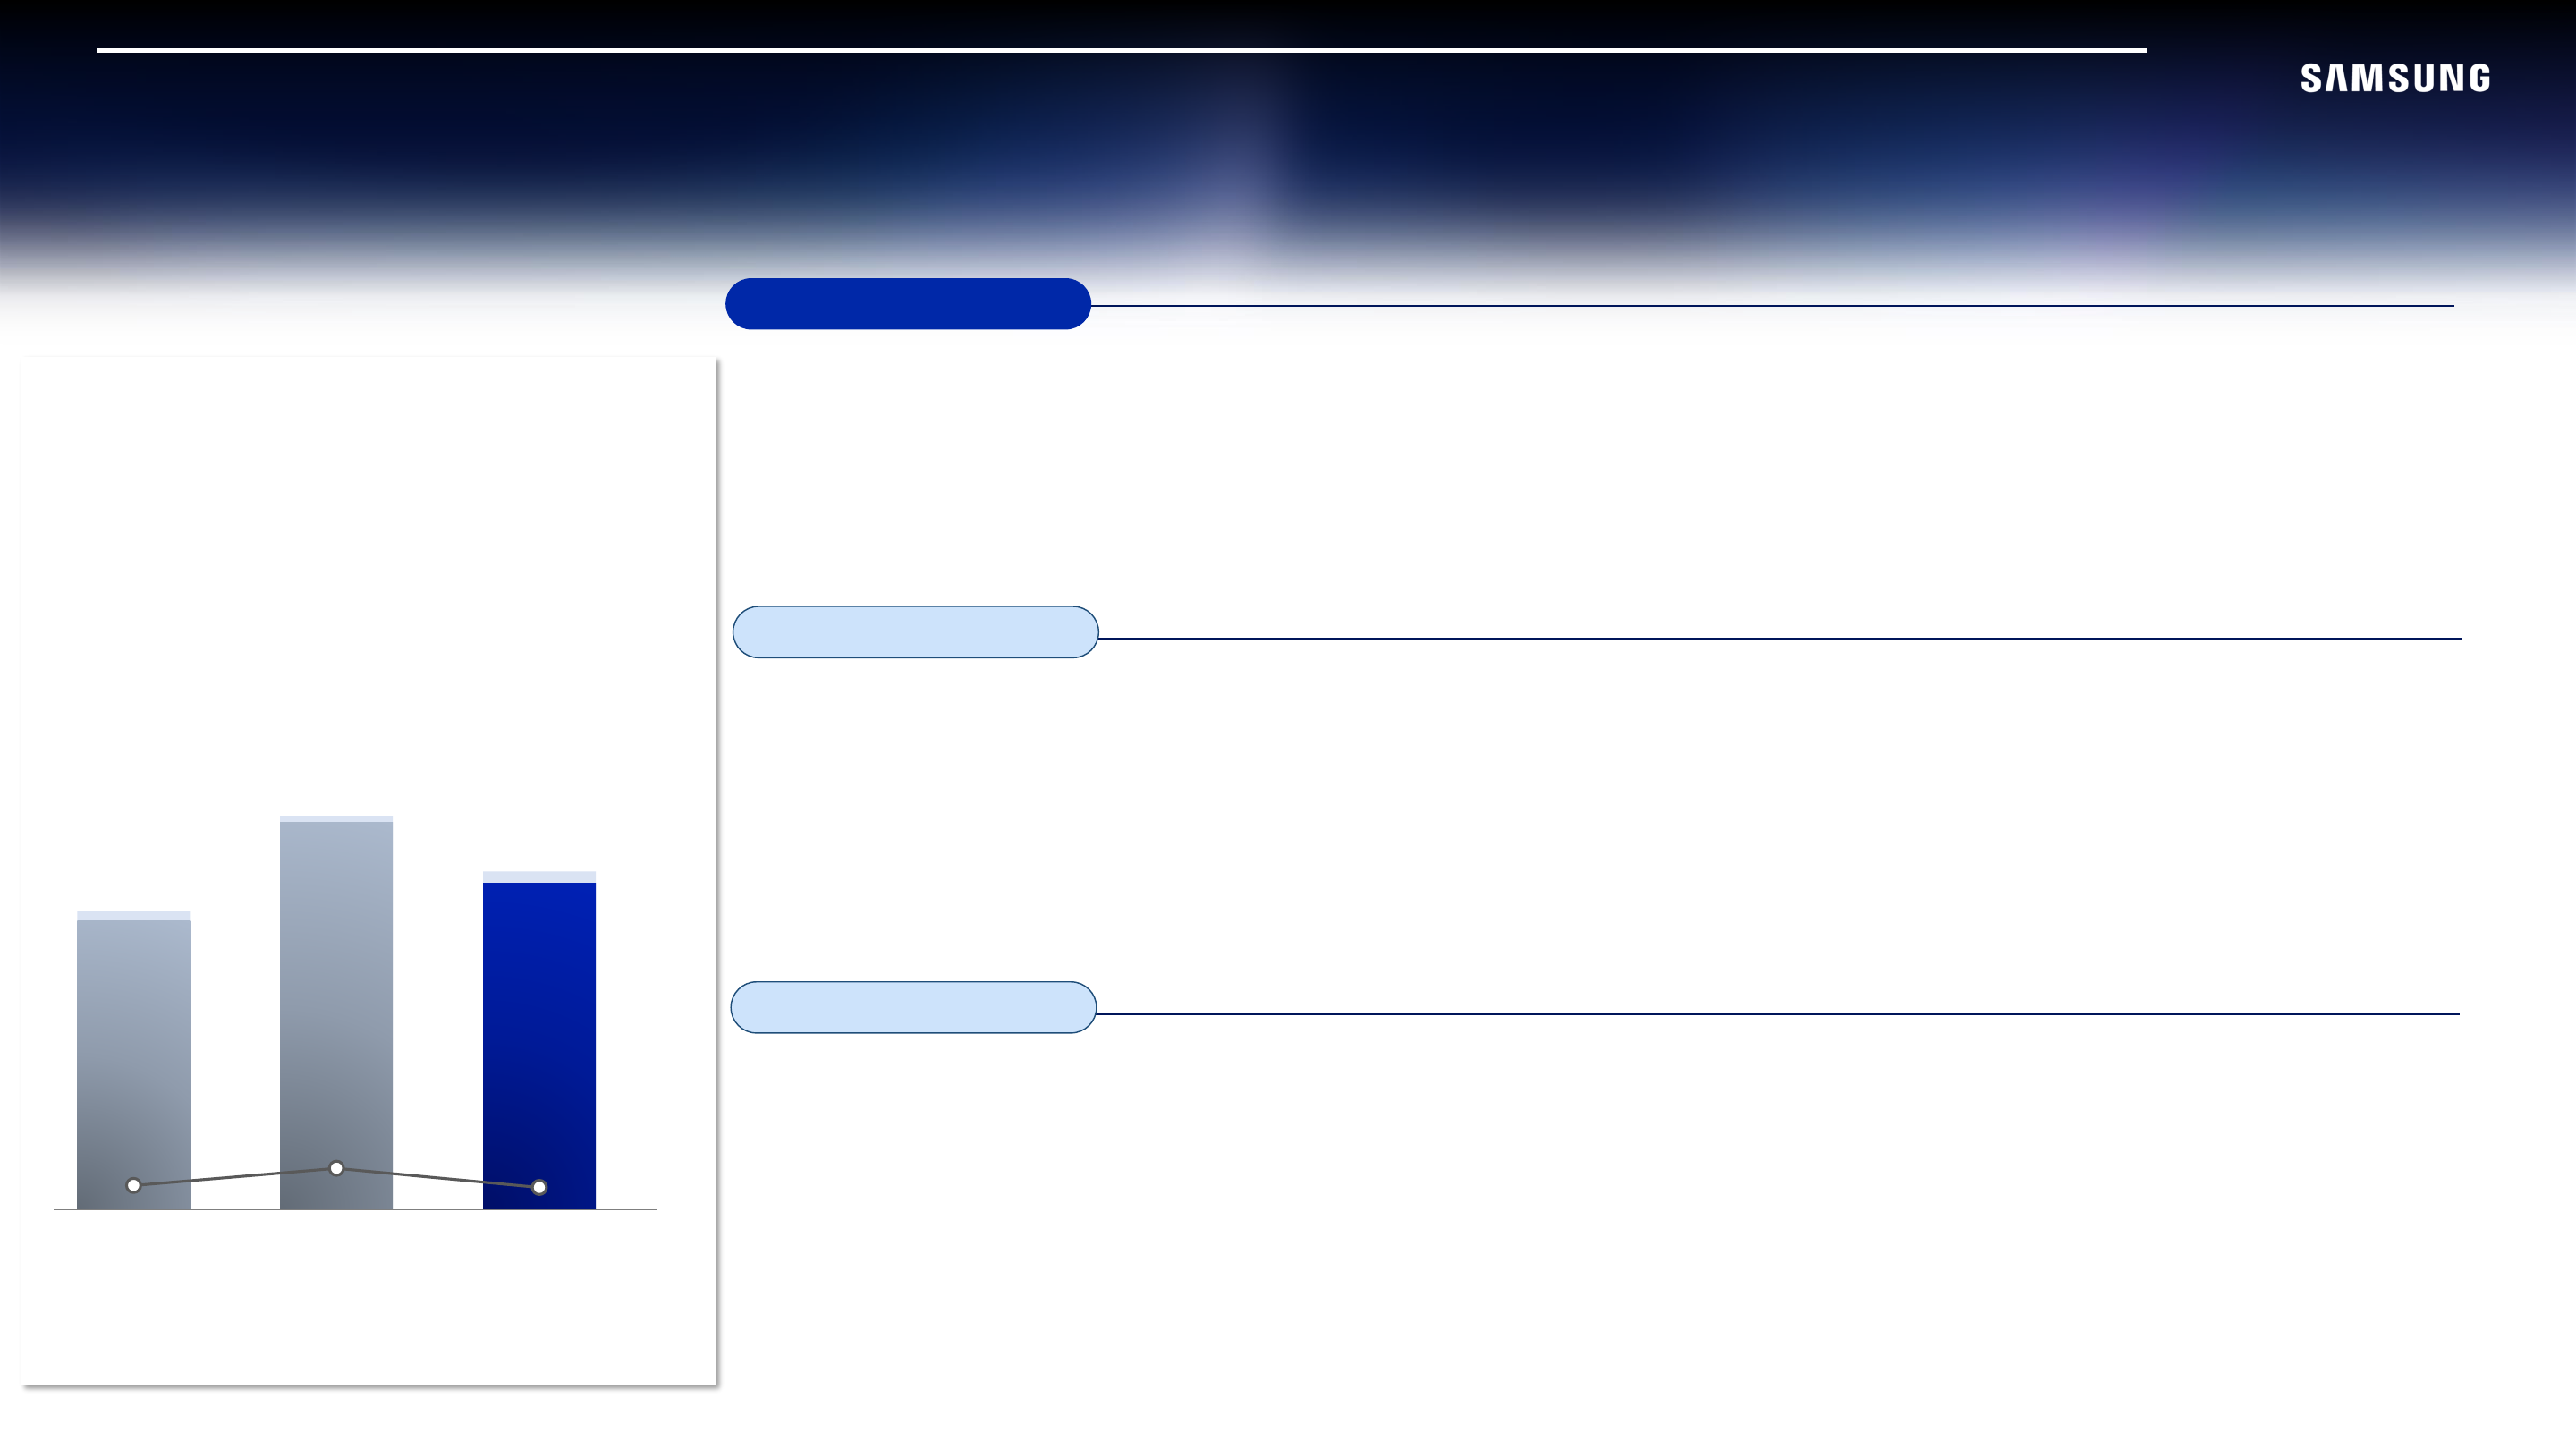
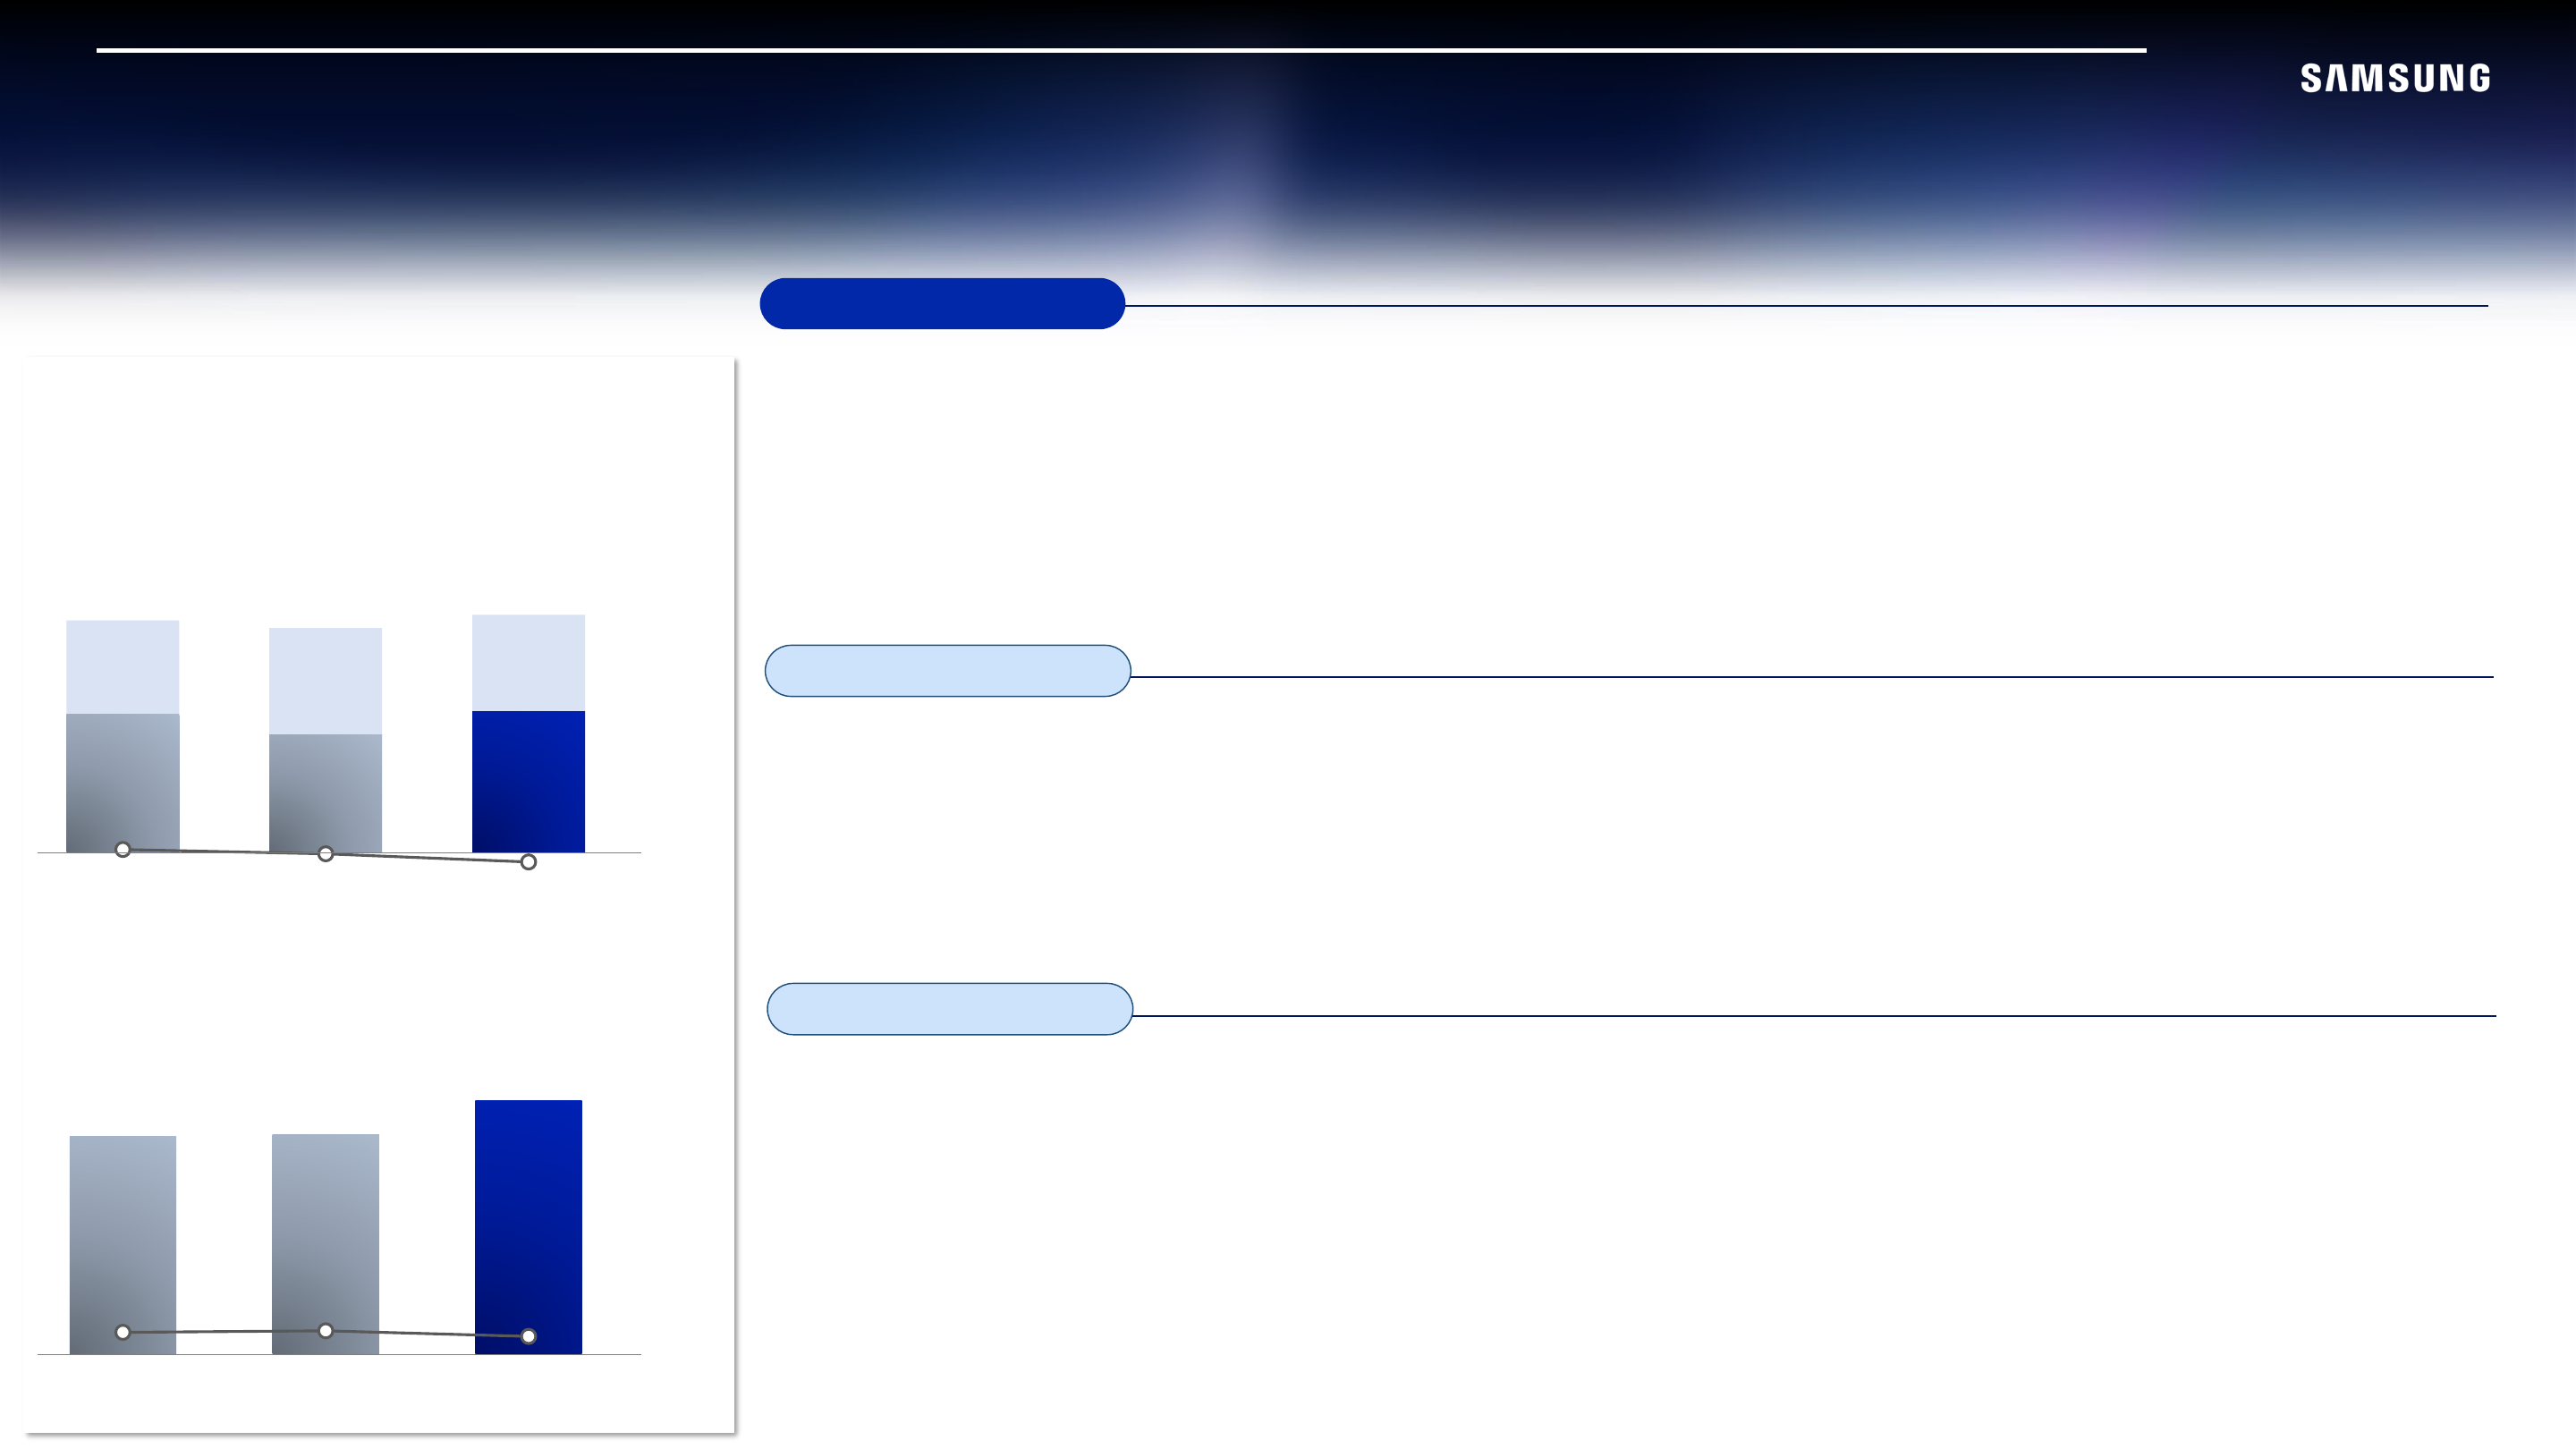
MX / NW
MX / NW results
(KRW trillion)
| 4Q24 | 3Q25 | 4Q25 | |
|---|---|---|---|
| Sales | 25.8 | 34.1 | 29.3 |
| OP | 2.1 | 3.6 | 1.9 |
4Q 2025 Results
MX
- Smartphone sales declined as new model launch effects normalized
- Achieved annual double-digit profit through flagship growth and stable tablet/wearables sales
NW
- Earnings improved QoQ/YoY, supported by sales growth in North America
1Q 2026 Outlook
MX
- Advance AI smartphone leadership by delivering Agentic AI experiences with the launch of S26
- Ensure sustained profitability via flagship-centric sales expansion and resource optimization
- Address global competitive uncertainties through strengthening supply stability
NW
- Drive revenue growth through new orders amidst Telco industry investment headwinds
2026 Outlook
MX
- Consolidate mobile AI leadership by leveraging next-gen AI experiences and slimmer/lighter form-factor innovation
- Pursue comprehensive growth across all segments via AI-driven product sales and new market expansion
- Uphold a steadfast commitment to profitability through process optimization amidst persistent cost pressures
NW
- Leverage vRAN/ORAN leadership to penetrate new markets while securing profitability through cost optimization
VD / DA / Harman
VD/DA results
(KRW trillion)
| 4Q24 | 3Q25 | 4Q25 | |
|---|---|---|---|
| Sales | 14.4 | 13.9 | 14.8 |
| Sales (VD) | 8.6 | 7.3 | 8.8 |
| OP | 0.2 | (0.1) | (0.1) |
Harman results
(KRW trillion)
| 4Q24 | 3Q25 | 4Q25 | |
|---|---|---|---|
| Sales | 3.9 | 4.0 | 4.6 |
| OP | 0.4 | 0.4 | 0.3 |
4Q 2025 Results
VD
- Expanded revenue through robust premium sales and response to peak season demand
- Profitability remained under pressure as intense market competition persisted
DA
- Earnings declined due to air conditioner (AC) low-demand season and U.S. tariff issues
Harman
- Achieved revenue growth by releasing new models (Portable/TWS) to address peak season demand and strengthening brand portfolio
1Q 2026 Outlook
VD
- Focus on revenue growth and profitability improvement based on reinforced new product lineups such as Micro RGB TVs
DA
- Anticipate earnings improvement via AI-product sales expansion and a seasonal recovery in air conditioner demand
Harman
- Expand automotive sales, including Digital Cockpit and Car audio, and sustain revenue growth in consumer audio business
2026 Outlook
VD
- Drive revenue growth by targeting replacement demand leveraging global sports events
- Enhance sales leadership in the market through differentiated customer experiences based on AI
DA
- Accelerate sales of AI-products and expand growth pillars in B2B, D2C, and subscription-based business areas
- Drive HVAC growth via FläktGroup synergies and profit-centric business structure alongside cost-efficiency initiatives
Harman
- Automotive: Seek to strengthen high-growth businesses and expand orders by acquiring ADAS capabilities
- Audio: Effort to expand premium-centric sales based on a reinforced brand portfolio
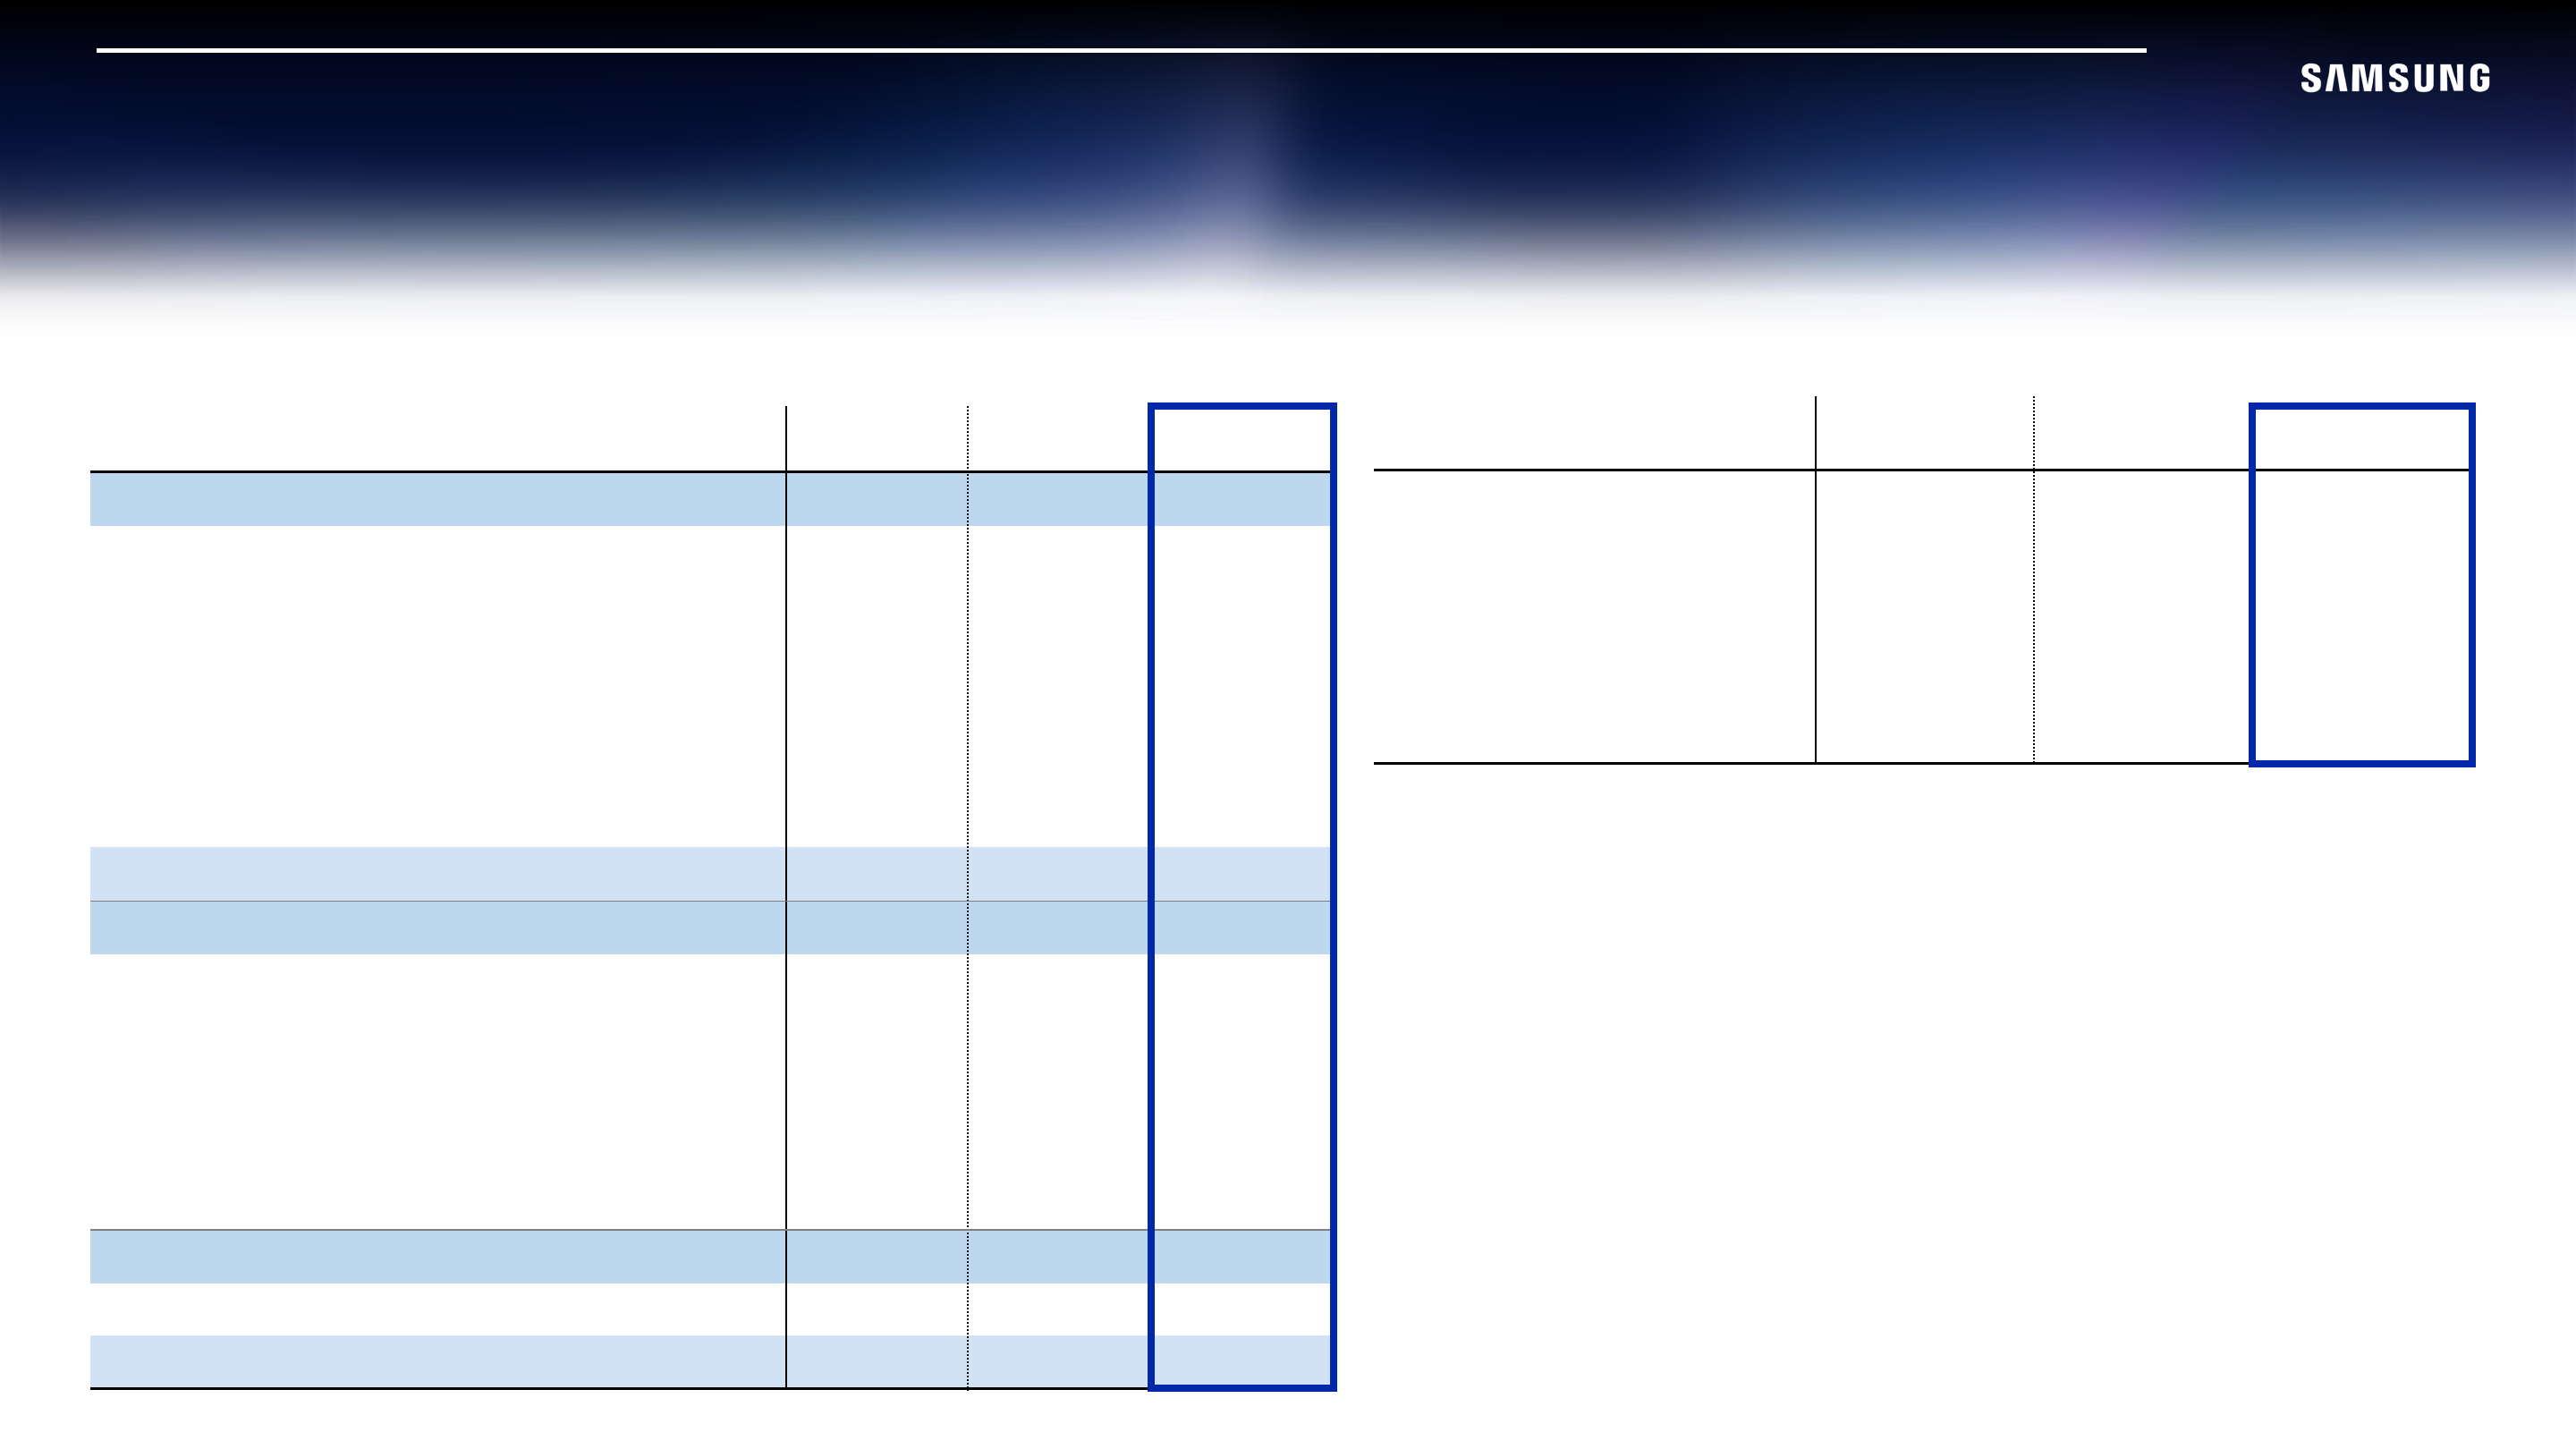
Appendix 1: Financial Position (Summary)
| KRW billion | 31.Dec.24 | 30.Sep.25 | 31.Dec.25 |
|---|---|---|---|
| Assets | 514,532.0 | 523,659.6 | 566,942.1 |
| Cash ※ | 112,651.8 | 108,463.8 | 125,847.1 |
| A/R | 43,623.1 | 50,538.8 | 51,127.6 |
| Inventories | 51,754.9 | 50,332.4 | 52,636.8 |
| Investments | 33,981.1 | 38,345.3 | 48,030.2 |
| PP&E | 205,945.2 | 204,861.1 | 215,304.8 |
| Intangible assets | 23,738.6 | 26,469.1 | 29,480.6 |
| Other assets | 42,837.3 | 44,649.1 | 44,515.0 |
| Total assets | 514,532.0 | 523,659.6 | 566,942.1 |
| Liabilities | 112,339.9 | 110,158.1 | 130,621.8 |
| Debts | 19,330.2 | 16,672.3 | 25,239.1 |
| Trade accounts and N/P | 12,370.2 | 14,417.4 | 13,039.4 |
| Other accounts and N/P & accrued expenses | 48,160.7 | 43,313.5 | 54,073.1 |
| Current income tax liabilities | 4,340.2 | 6,189.6 | 7,037.2 |
| Unearned revenue & other advances | 2,833.2 | 2,953.8 | 2,935.5 |
| Other liabilities | 25,305.4 | 26,611.5 | 28,297.5 |
| Shareholder equity | 402,192.1 | 413,501.5 | 436,320.3 |
| Capital stock | 897.5 | 897.5 | 897.5 |
| Total liability & Shareholder equity | 514,532.0 | 523,659.6 | 566,942.1 |
| 31.Dec.24 | 30.Sep.25 | 31.Dec.25 | |
|---|---|---|---|
| Current ratio ※ | 243% | 263% | 233% |
| Liability/equity | 28% | 27% | 30% |
| Debt/equity | 5% | 4% | 6% |
| Net debt/equity | (23%) | (22%) | (23%) |
※ Cash = Cash and Cash equivalents Short-term financial instruments Short-term financial assets at amortized cost etc. ※ Current ratio = current assets/current liabilities
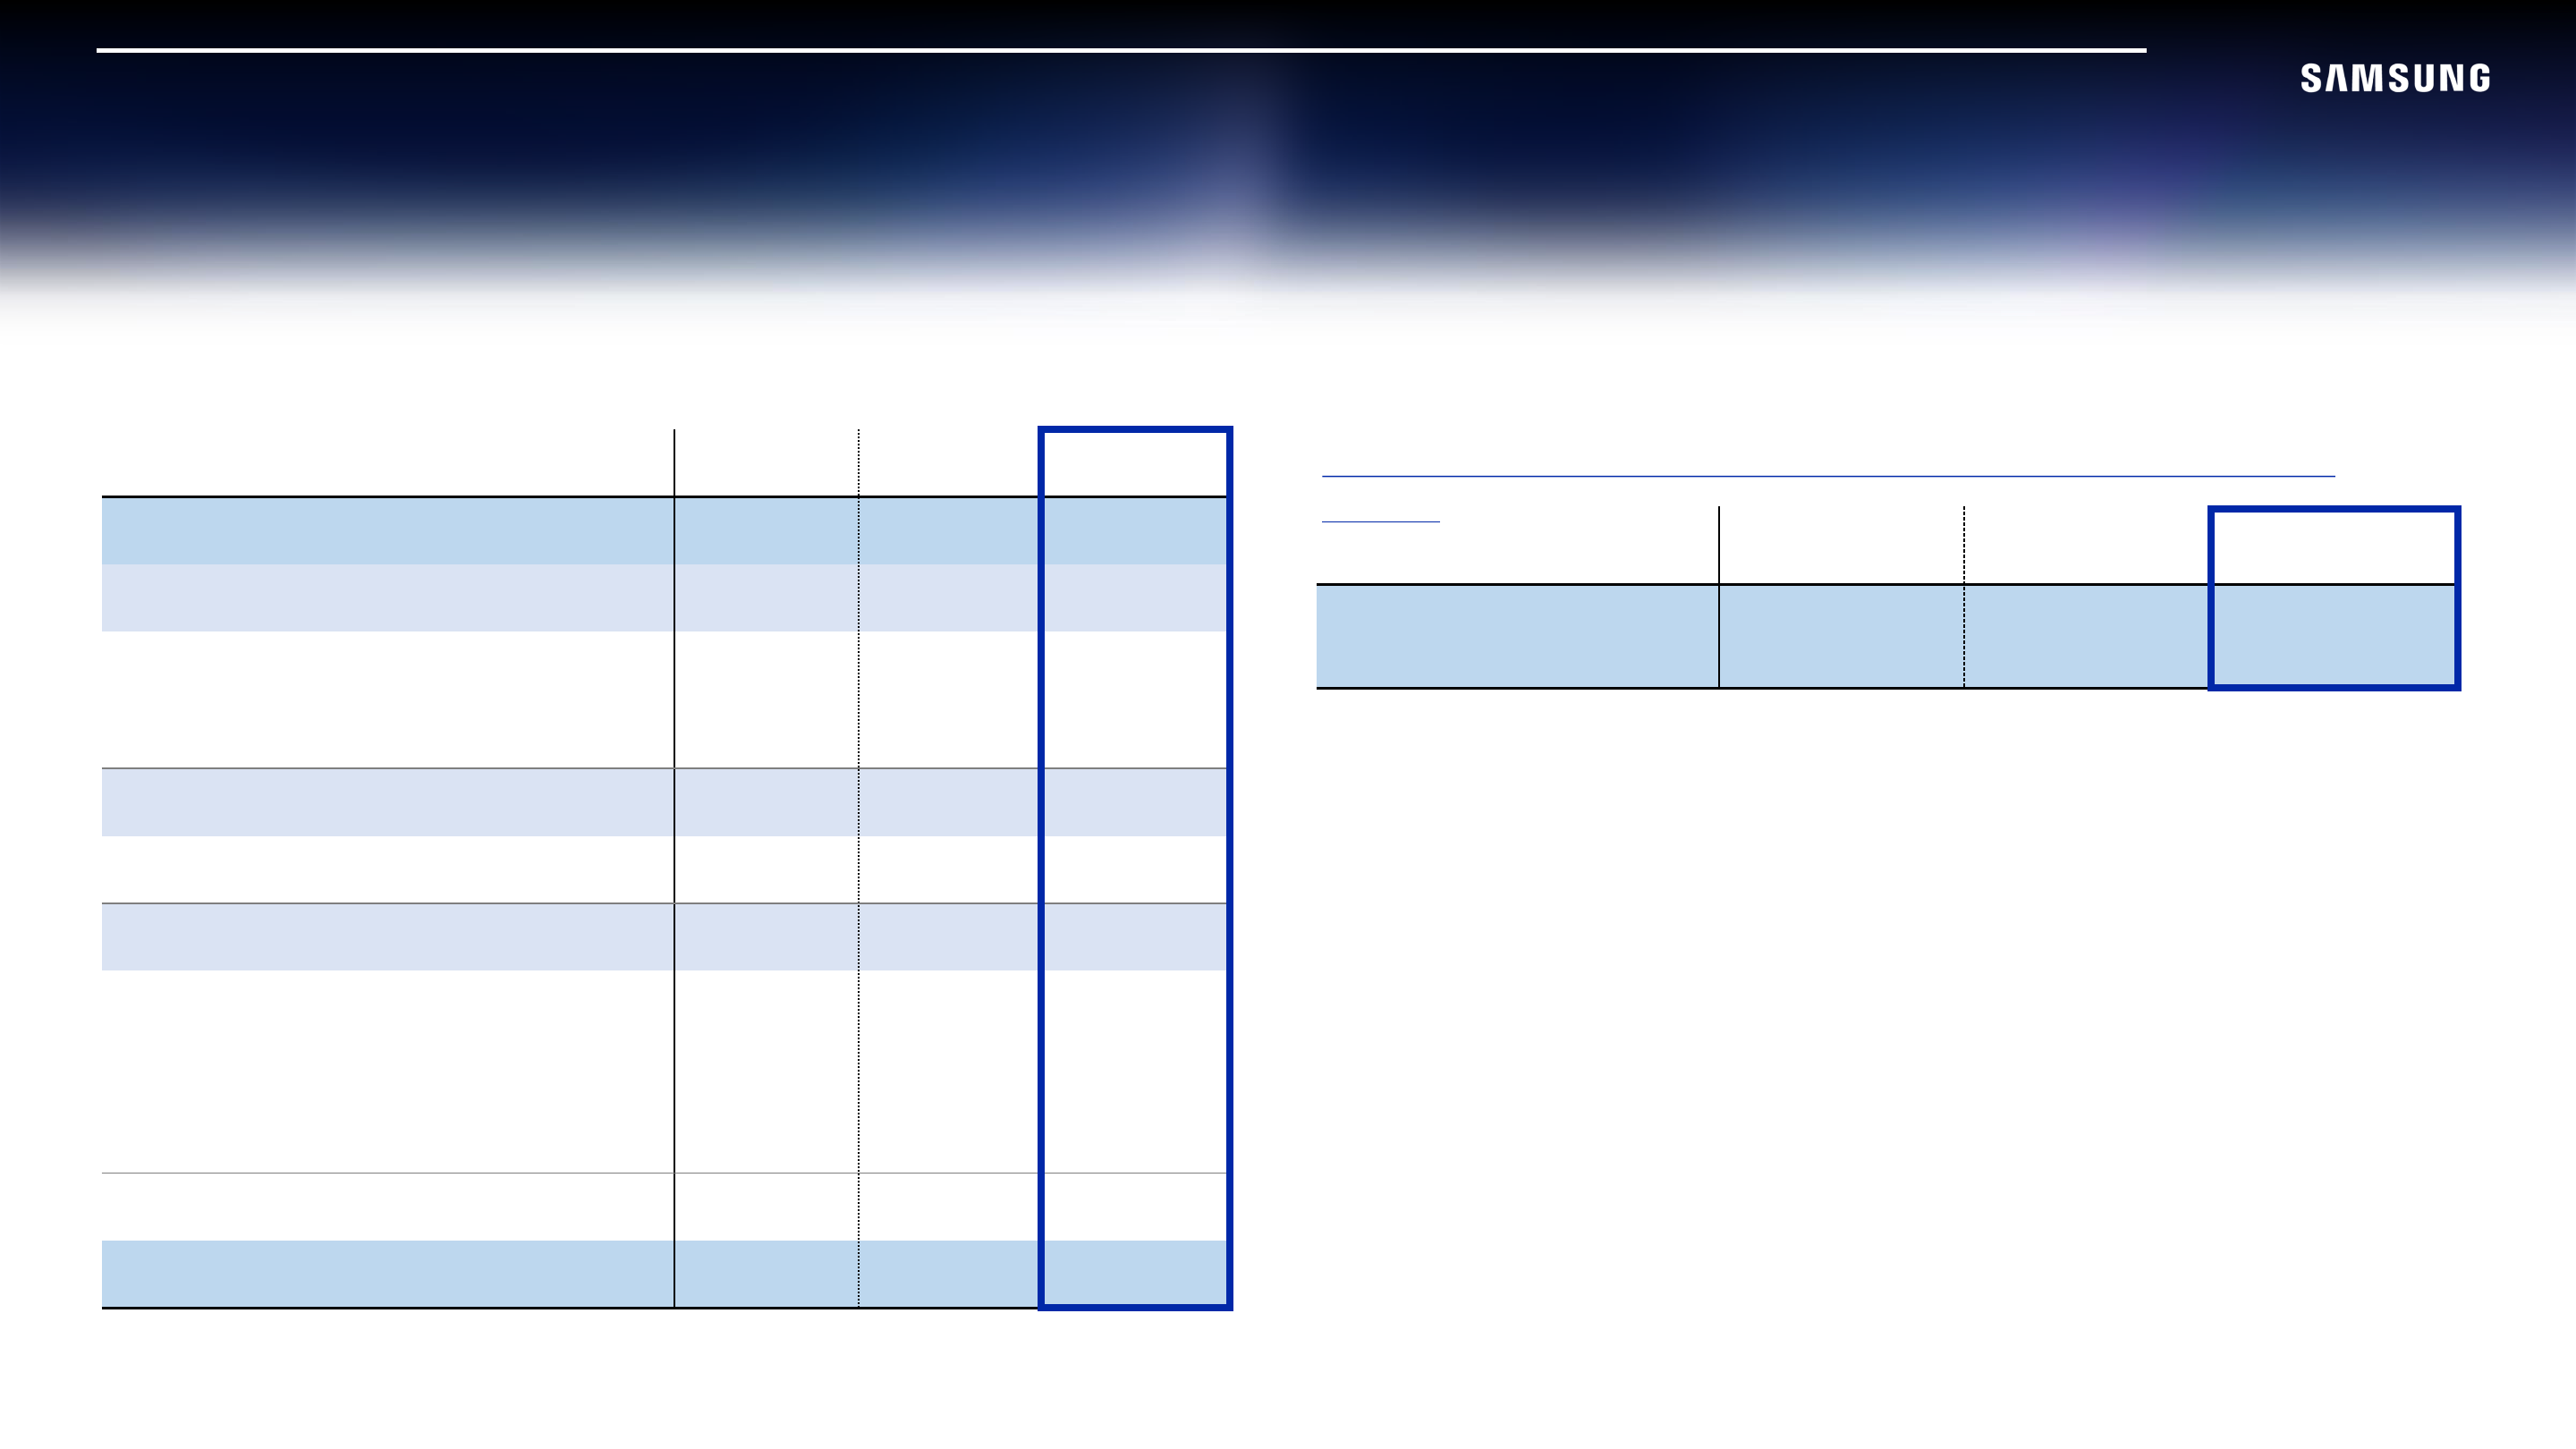
Appendix 2: Cash Flow (Summary)
| KRW trillion | 2024 | 4Q25 | 2025 |
|---|---|---|---|
| Cash (beginning of period) ※ | 92.41 | 108.46 | 112.65 |
| Cash flows from operating activities | 72.98 | 28.80 | 85.32 |
| Net profit | 34.45 | 19.64 | 45.21 |
| Depreciation | 39.65 | 11.36 | 43.61 |
| Cash flows from investing activities | (53.37) | (18.86) | (58.83) |
| Purchase of PP&E | (51.41) | (11.55) | (47.52) |
| Cash flows from financing activities | (7.80) | 5.46 | (13.48) |
| Increase in debts | 4.91 | 7.95 | 4.61 |
| Acquisition of treasury stock | (1.81) | (0.04) | (8.19) |
| Payment of dividends | (10.89) | (2.45) | (9.90) |
| Increase in cash | 20.24 | 17.38 | 13.20 |
| Cash (end of period) ※ | 112.65 | 125.85 | 125.85 |
※ Cash = Cash and cash equivalents short-term financial instruments short-term financial assets at amortized cost etc.
Current State of Net Cash (Net Cash = Cash ※ - Debts)
| KRW trillion | 31.Dec.24 | 30.Sep.25 | 31.Dec.25 |
|---|---|---|---|
| Net Cash | 93.32 | 91.79 | 100.61 |
※ Cash = Cash and cash equivalents short-term financial instruments short-term financial assets at amortized cost etc.