SAMSUNG ELECTRONICS
Earnings Presentation: 3Q 2025 Financial Results
Disclaimer
The financial information in this document are consolidated earnings results based on K-IFRS.
This document is provided for the convenience of investors only before the external review on our 3Q 2025 financial results is completed. The Audit outcomes may cause some parts of this document to change.
This document contains "forward-looking statements" - that is statements related to future not past events. In this context "forward-looking statements" often address our expected future business and financial performance and often contain words such as "expects" "anticipates" "intends" "plans" "believes" "seeks" or "will". "Forward-looking statements" by their nature address matters that are to different degrees uncertain. For us particular uncertainties which could adversely or positively affect our future results include:
· The behavior of financial markets including fluctuations in exchange rates interest rates and commodity prices · Strategic actions including dispositions and acquisitions · Unanticipated dramatic developments in our major businesses including DX (Digital eXperience) DS (Device Solutions) · Numerous other matters at the national and international levels which could affect our future results
These uncertainties may cause our actual results to be materially different from those expressed in this document.
Index
| PRESENTERS | 3Q 2025 FINANCIAL RESULTS | PERFORMANCE BY BUSINESS SEGMENT | APPENDICES |
Earnings Presentation
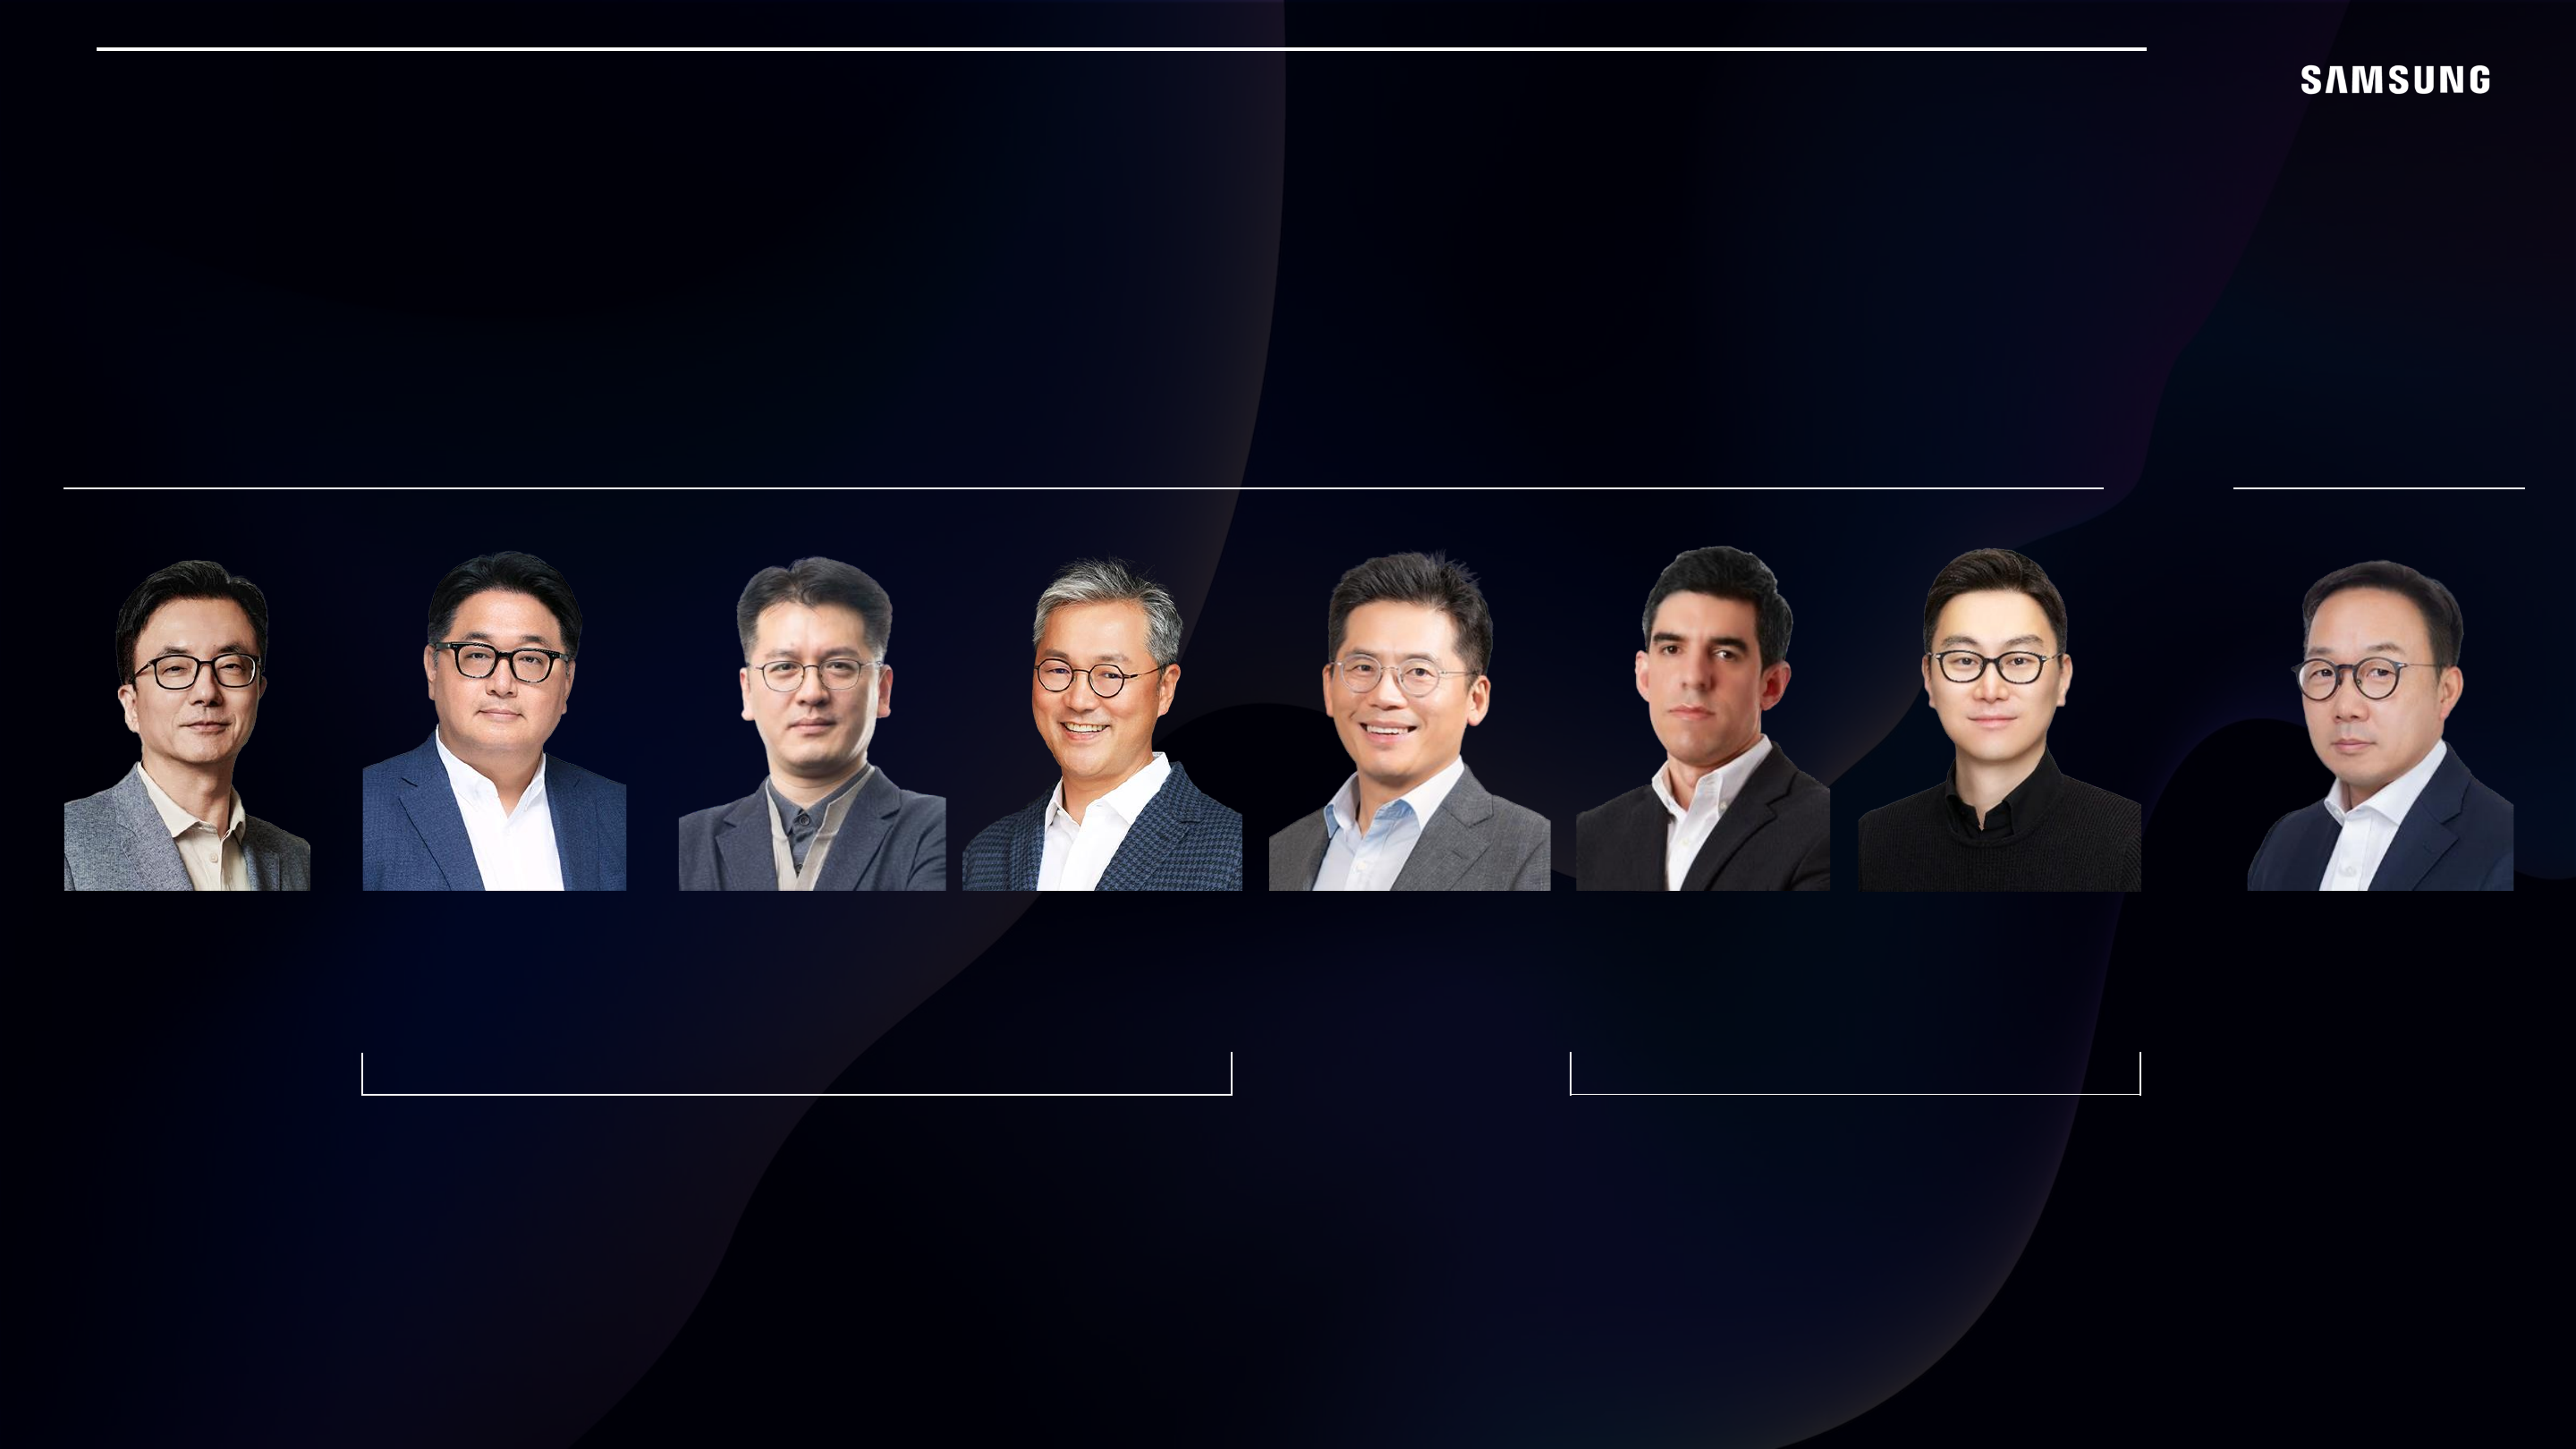
Presenters
| Sooncheol Park, EVP | Jaejune Kim, EVP | Hyeokman Kwon, VP | Sukchae Kang, EVP | Joonyoung Park, EVP | Daniel Araujo, VP | Mark Kim, VP | Daniel Oh, EVP |
| Chief Financial Officer | Memory | System LSI | Foundry | Samsung Display Corp | Mobile eXperience | Visual Display | Investor Relations |
Device Solutions: Jaejune Kim (Memory), Hyeokman Kwon (System LSI), Sukchae Kang (Foundry)
Device eXperience: Joonyoung Park (Samsung Display Corp), Daniel Araujo (Mobile eXperience), Mark Kim (Visual Display)
Moderator: Daniel Oh, EVP, Investor Relations
3Q 2025 Highlights
Based on consolidated financial statements
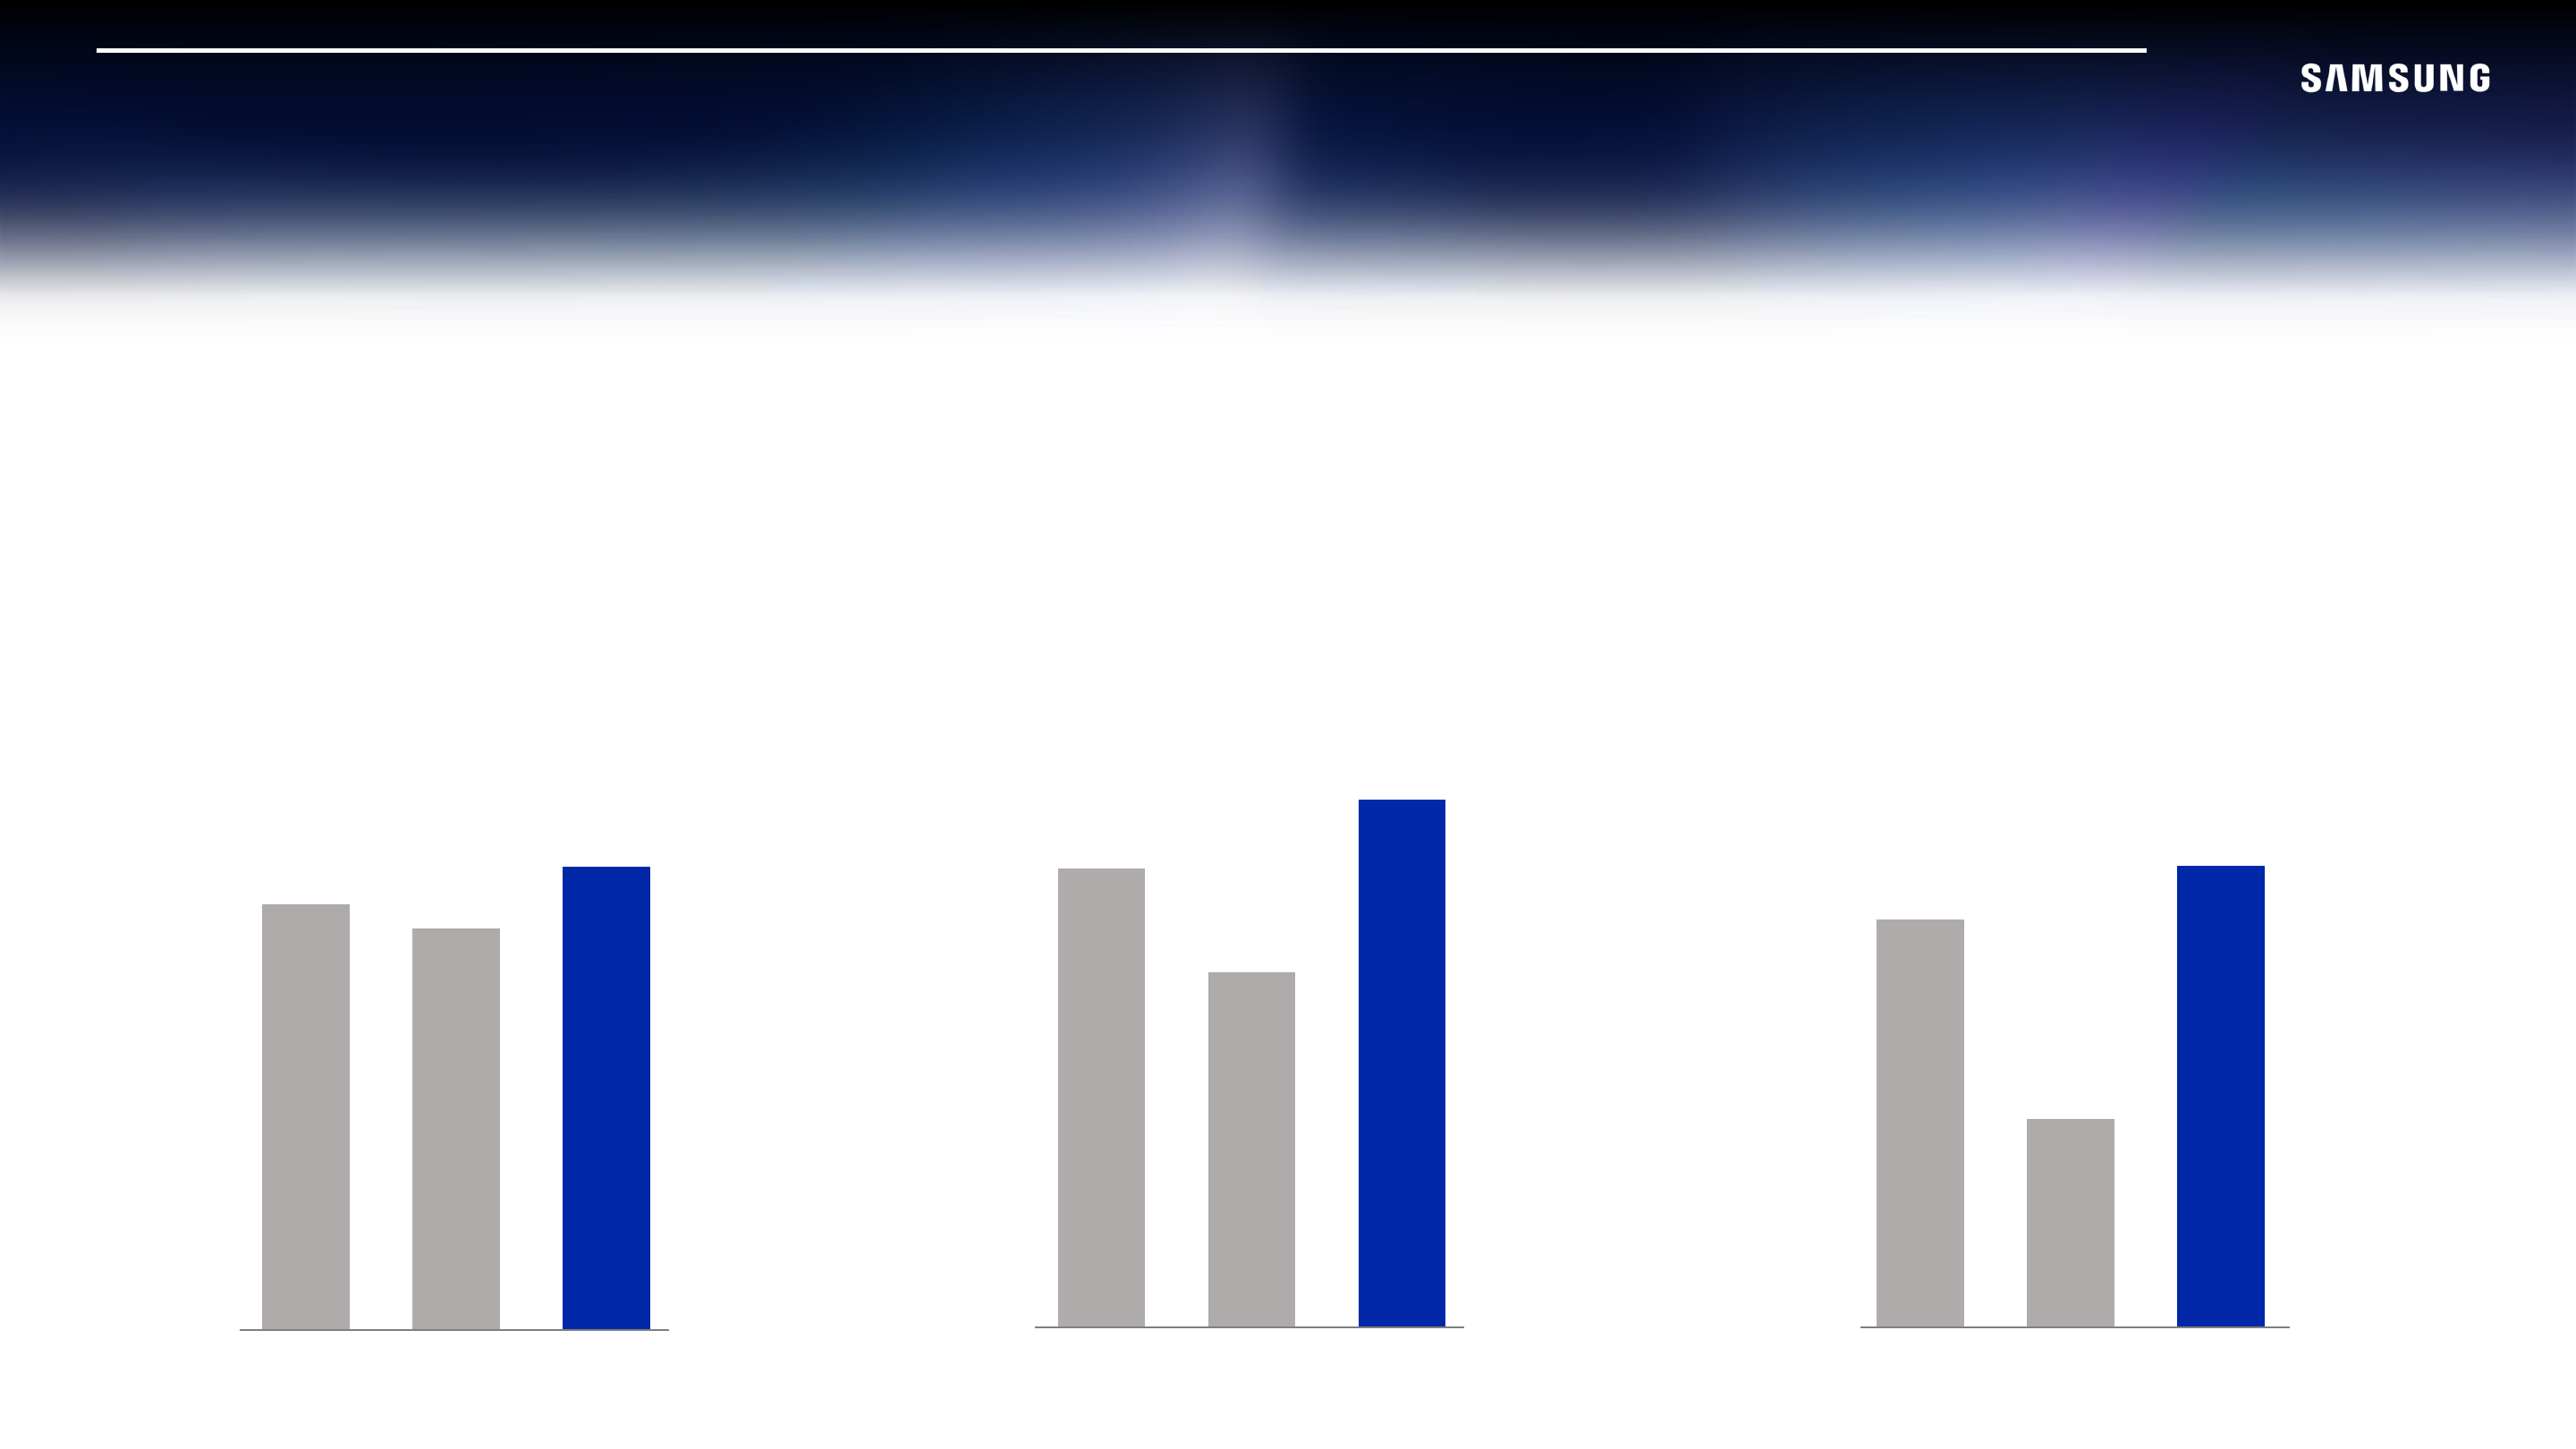
Revenue: KRW86.1T | Gross Profit: KRW33.5T | Operating Profit: KRW12.2T
| Metric | 3Q24 | 2Q25 | 3Q25 |
|---|---|---|---|
| Revenue (KRW T) | 79.1 | 74.6 | 86.1 |
| Gross Profit (KRW T) | 30.0 | 25.5 | 33.5 |
| Operating Profit (KRW T) | 9.2 | 4.7 | 12.2 |
3Q 2025 Results & Financial Data
Based on consolidated financial statements
| KRW trillion | 3Q24 | % of sales | 2Q25 | % of sales | 3Q25 | % of sales |
|---|---|---|---|---|---|---|
| Sales | 79.1 | 100.0% | 74.6 | 100.0% | 86.1 | 100.0% |
| Cost of sales | 49.1 | 62.1% | 49.1 | 65.8% | 52.6 | 61.1% |
| Gross profit | 30.0 | 37.9% | 25.5 | 34.2% | 33.5 | 38.9% |
| SG&A expenses | 20.8 | 26.3% | 20.8 | 27.9% | 21.3 | 24.8% |
| R&D expenses | 8.9 | 11.2% | 9.0 | 12.1% | 8.8 | 10.3% |
| Operating profit | 9.2 | 11.6% | 4.7 | 6.3% | 12.2 | 14.1% |
| Other non-operating income/expenses | 0.2 | - | 0.02 | - | (0.1) | - |
| Equity method gain/loss | 0.2 | - | 0.2 | - | 0.3 | - |
| Finance income/expenses | 0.8 | - | 0.9 | - | 1.2 | - |
| Profit before income tax | 10.3 | 13.0% | 5.8 | 7.7% | 13.5 | 15.7% |
| Income tax | 0.2 | - | 0.6 | - | 1.3 | - |
| Net profit | 10.1 | 12.8% | 5.1 | 6.9% | 12.2 | 14.2% |
| Profit attributable to owners of the parent | 9.8 | 12.4% | 4.9 | 6.6% | 12.0 | 14.0% |
| Earnings per share (KRW) | 1,440 | 737 | 1,802 |
Sales and operating profit growth
Key profitability indicators
| 3Q24 | 2Q25 | 3Q25 | |
|---|---|---|---|
| ROE | 11% | 5% | 12% |
| Profitability (net profit/sales) | 0.13 | 0.07 | 0.14 |
| Asset turnover (sales/asset) | 0.67 | 0.59 | 0.66 |
| Leverage (asset/equity) | 1.26 | 1.27 | 1.27 |
| EBITDA margin | 25% | 20% | 27% |
Results by Business Segment
Sales
| KRW trillion | 3Q24 | 2Q25 | 3Q25 | QoQ | YoY |
|---|---|---|---|---|---|
| Total | 79.1 | 74.6 | 86.1 | 15%↑ | 9%↑ |
| DX | 45.0 | 43.6 | 48.4 | 11%↑ | 8%↑ |
| MX / NW | 30.5 | 29.2 | 34.1 | 17%↑ | 12%↑ |
| MX | 30.0 | 28.5 | 33.5 | 18%↑ | 12%↑ |
| VD / DA | 14.1 | 14.1 | 13.9 | 1%↓ | 1%↓ |
| VD | 7.6 | 7.0 | 7.3 | 4%↑ | 4%↓ |
| DS | 29.3 | 27.9 | 33.1 | 19%↑ | 13%↑ |
| Memory | 22.3 | 21.2 | 26.7 | 26%↑ | 20%↑ |
| SDC | 8.0 | 6.4 | 8.1 | 27%↑ | 1%↑ |
| Harman | 3.5 | 3.8 | 4.0 | 3%↑ | 12%↑ |
Operating profit
| KRW trillion | 3Q24 | 2Q25 | 3Q25 | QoQ | YoY |
|---|---|---|---|---|---|
| Total | 9.2 | 4.7 | 12.2 | 7.5↑ | 3.0↑ |
| DX | 3.4 | 3.3 | 3.5 | 0.1↑ | 0.1↑ |
| MX / NW | 2.8 | 3.1 | 3.6 | 0.5↑ | 0.7↑ |
| VD / DA | 0.5 | 0.2 | (0.1) | 0.3↓ | 0.6↓ |
| DS | 3.9 | 0.4 | 7.0 | 6.6↑ | 3.1↑ |
| SDC | 1.5 | 0.5 | 1.2 | 0.8↑ | 0.3↓ |
| Harman | 0.4 | 0.5 | 0.4 | 0.1↓ | 0.1↑ |
※ Sales and operating profit of each business stated above reflect the organizational structure as of December 2021 and the sales of business units include intersegment sales. ※ The DX Division provides earnings call materials based on the business structure before the reorganization to prevent confusion and to improve understanding among investors. ※ DX: Device eXperience MX: Mobile eXperience DS: Device Solutions ※ Sales and operating profit of VD/DA include the results of Health & Medical Equipment business. ※ Harman's sales and operating profit figures are based on Samsung Electronics' fiscal year and acquisition related expenses are reflected.
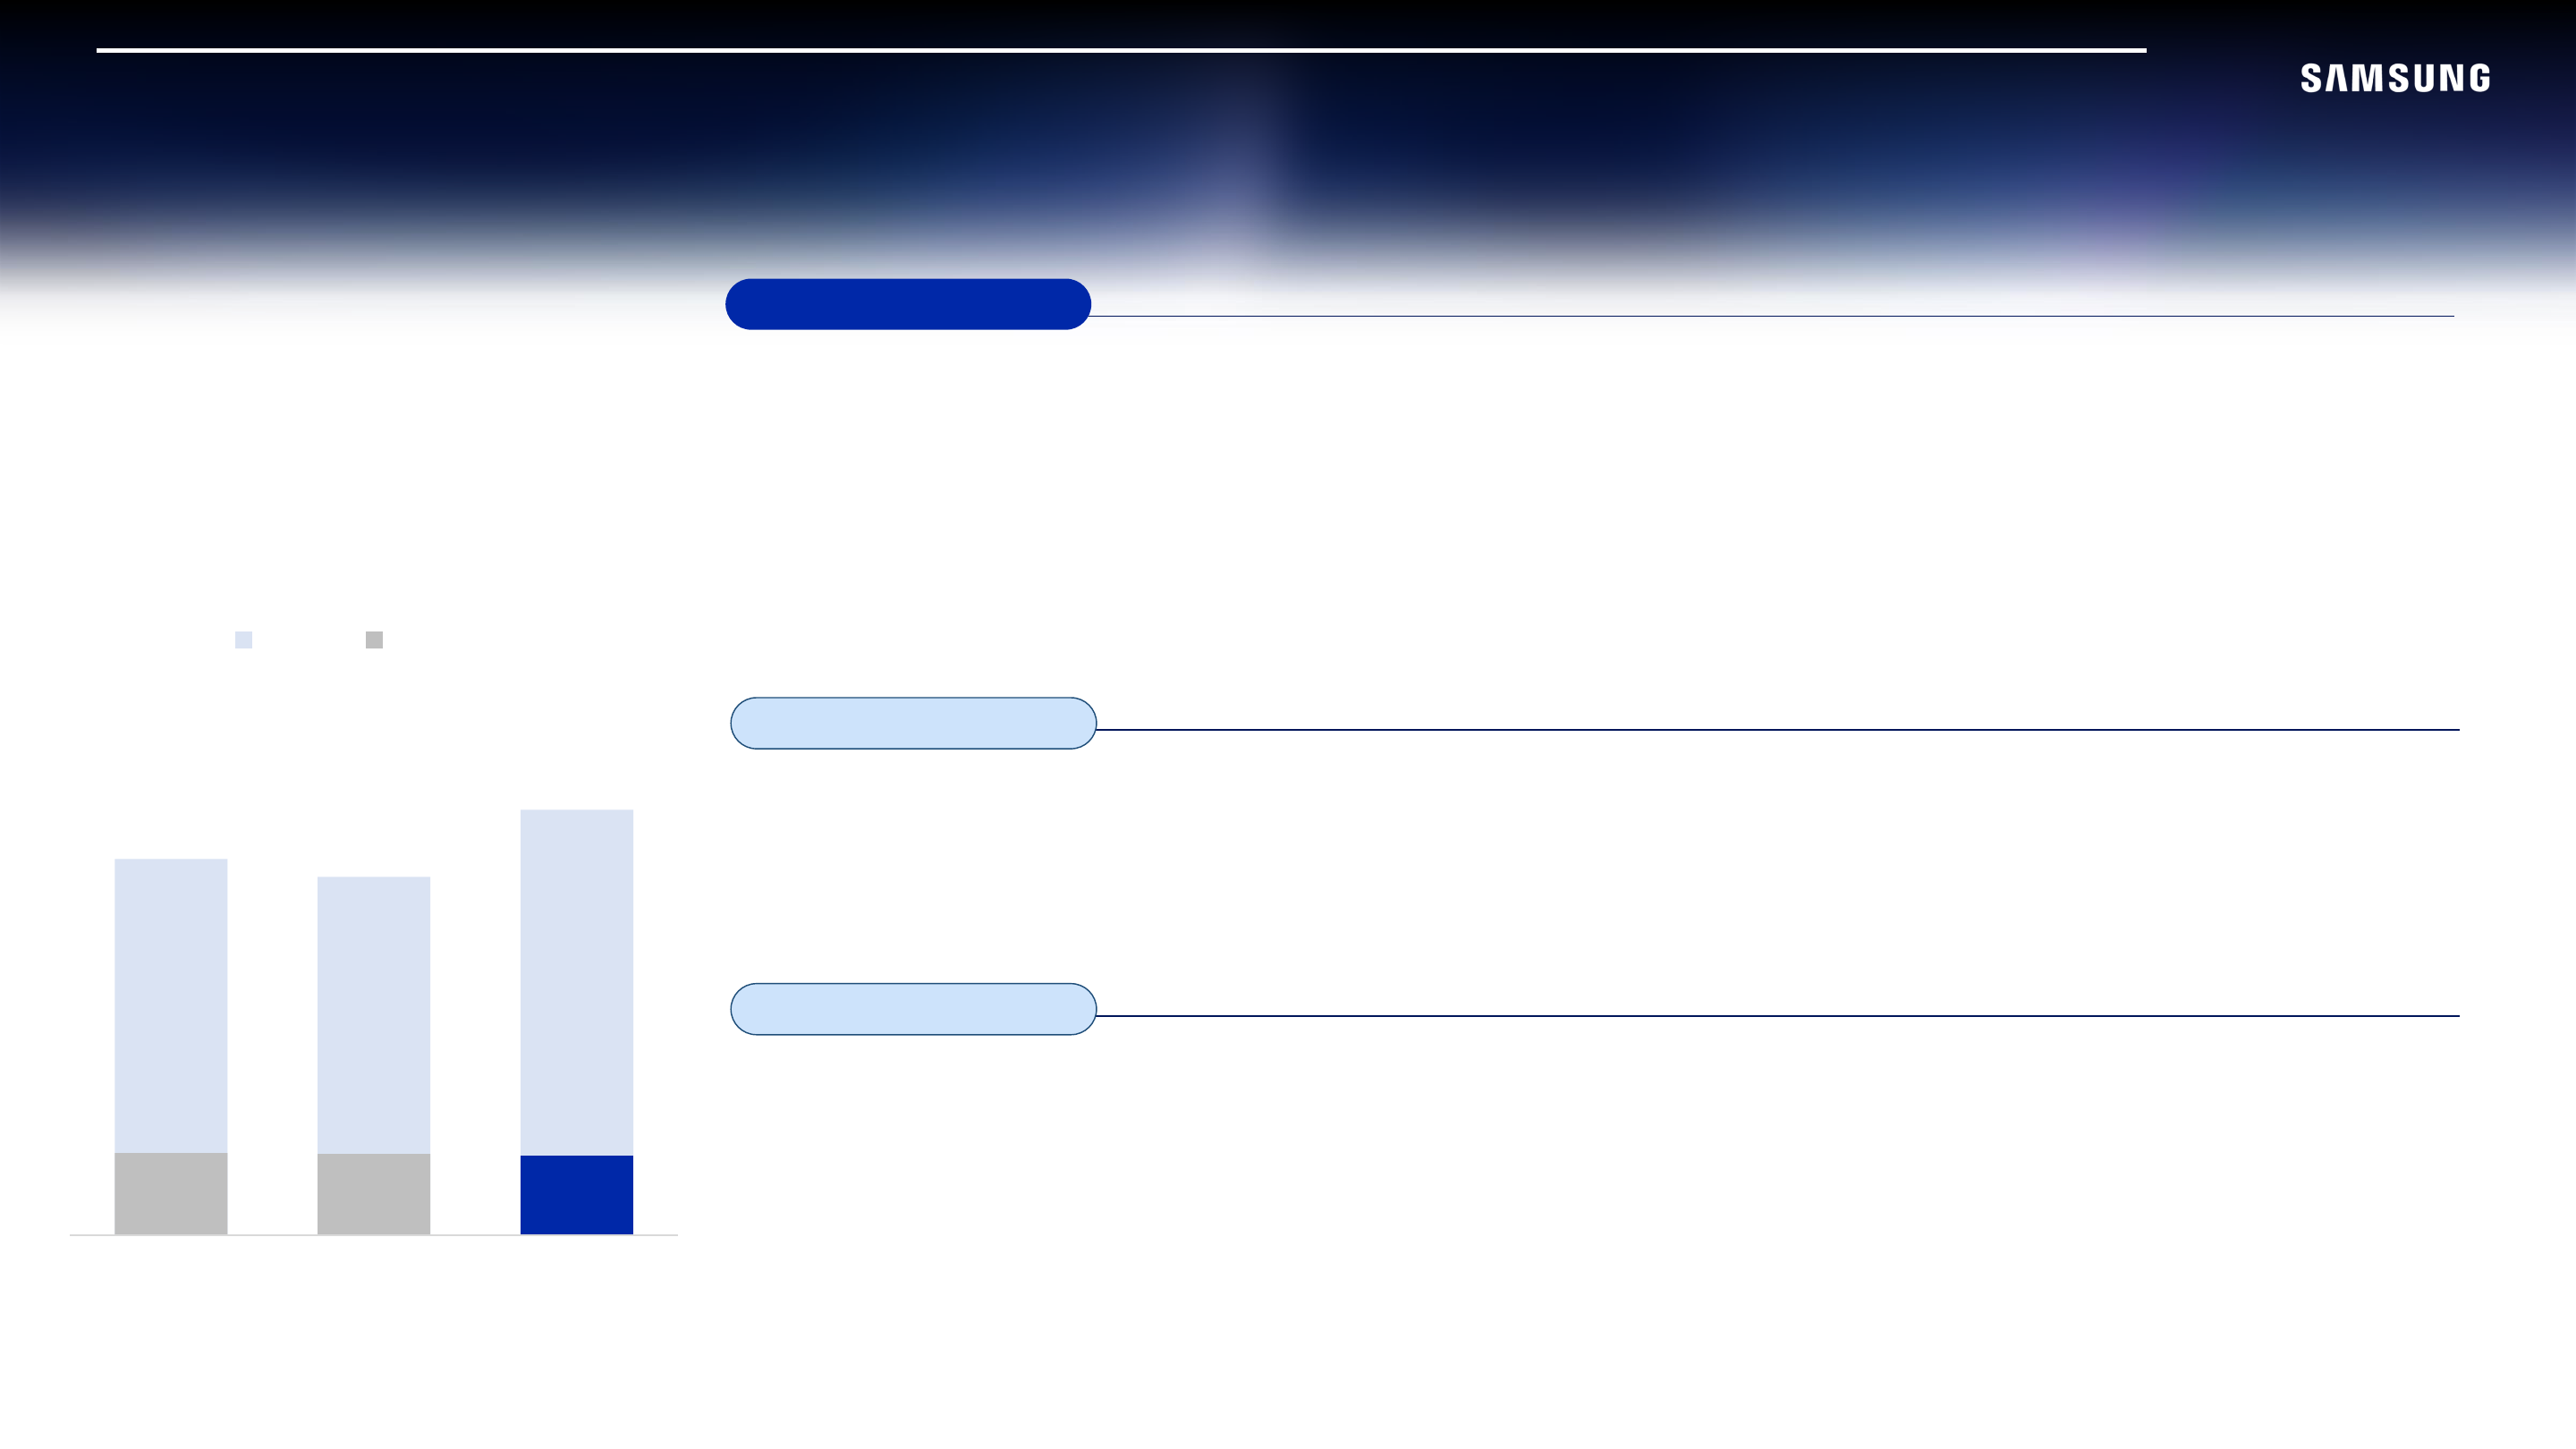
Memory
DS results
KRW trillion
| 3Q24 | 2Q25 | 3Q25 | |
|---|---|---|---|
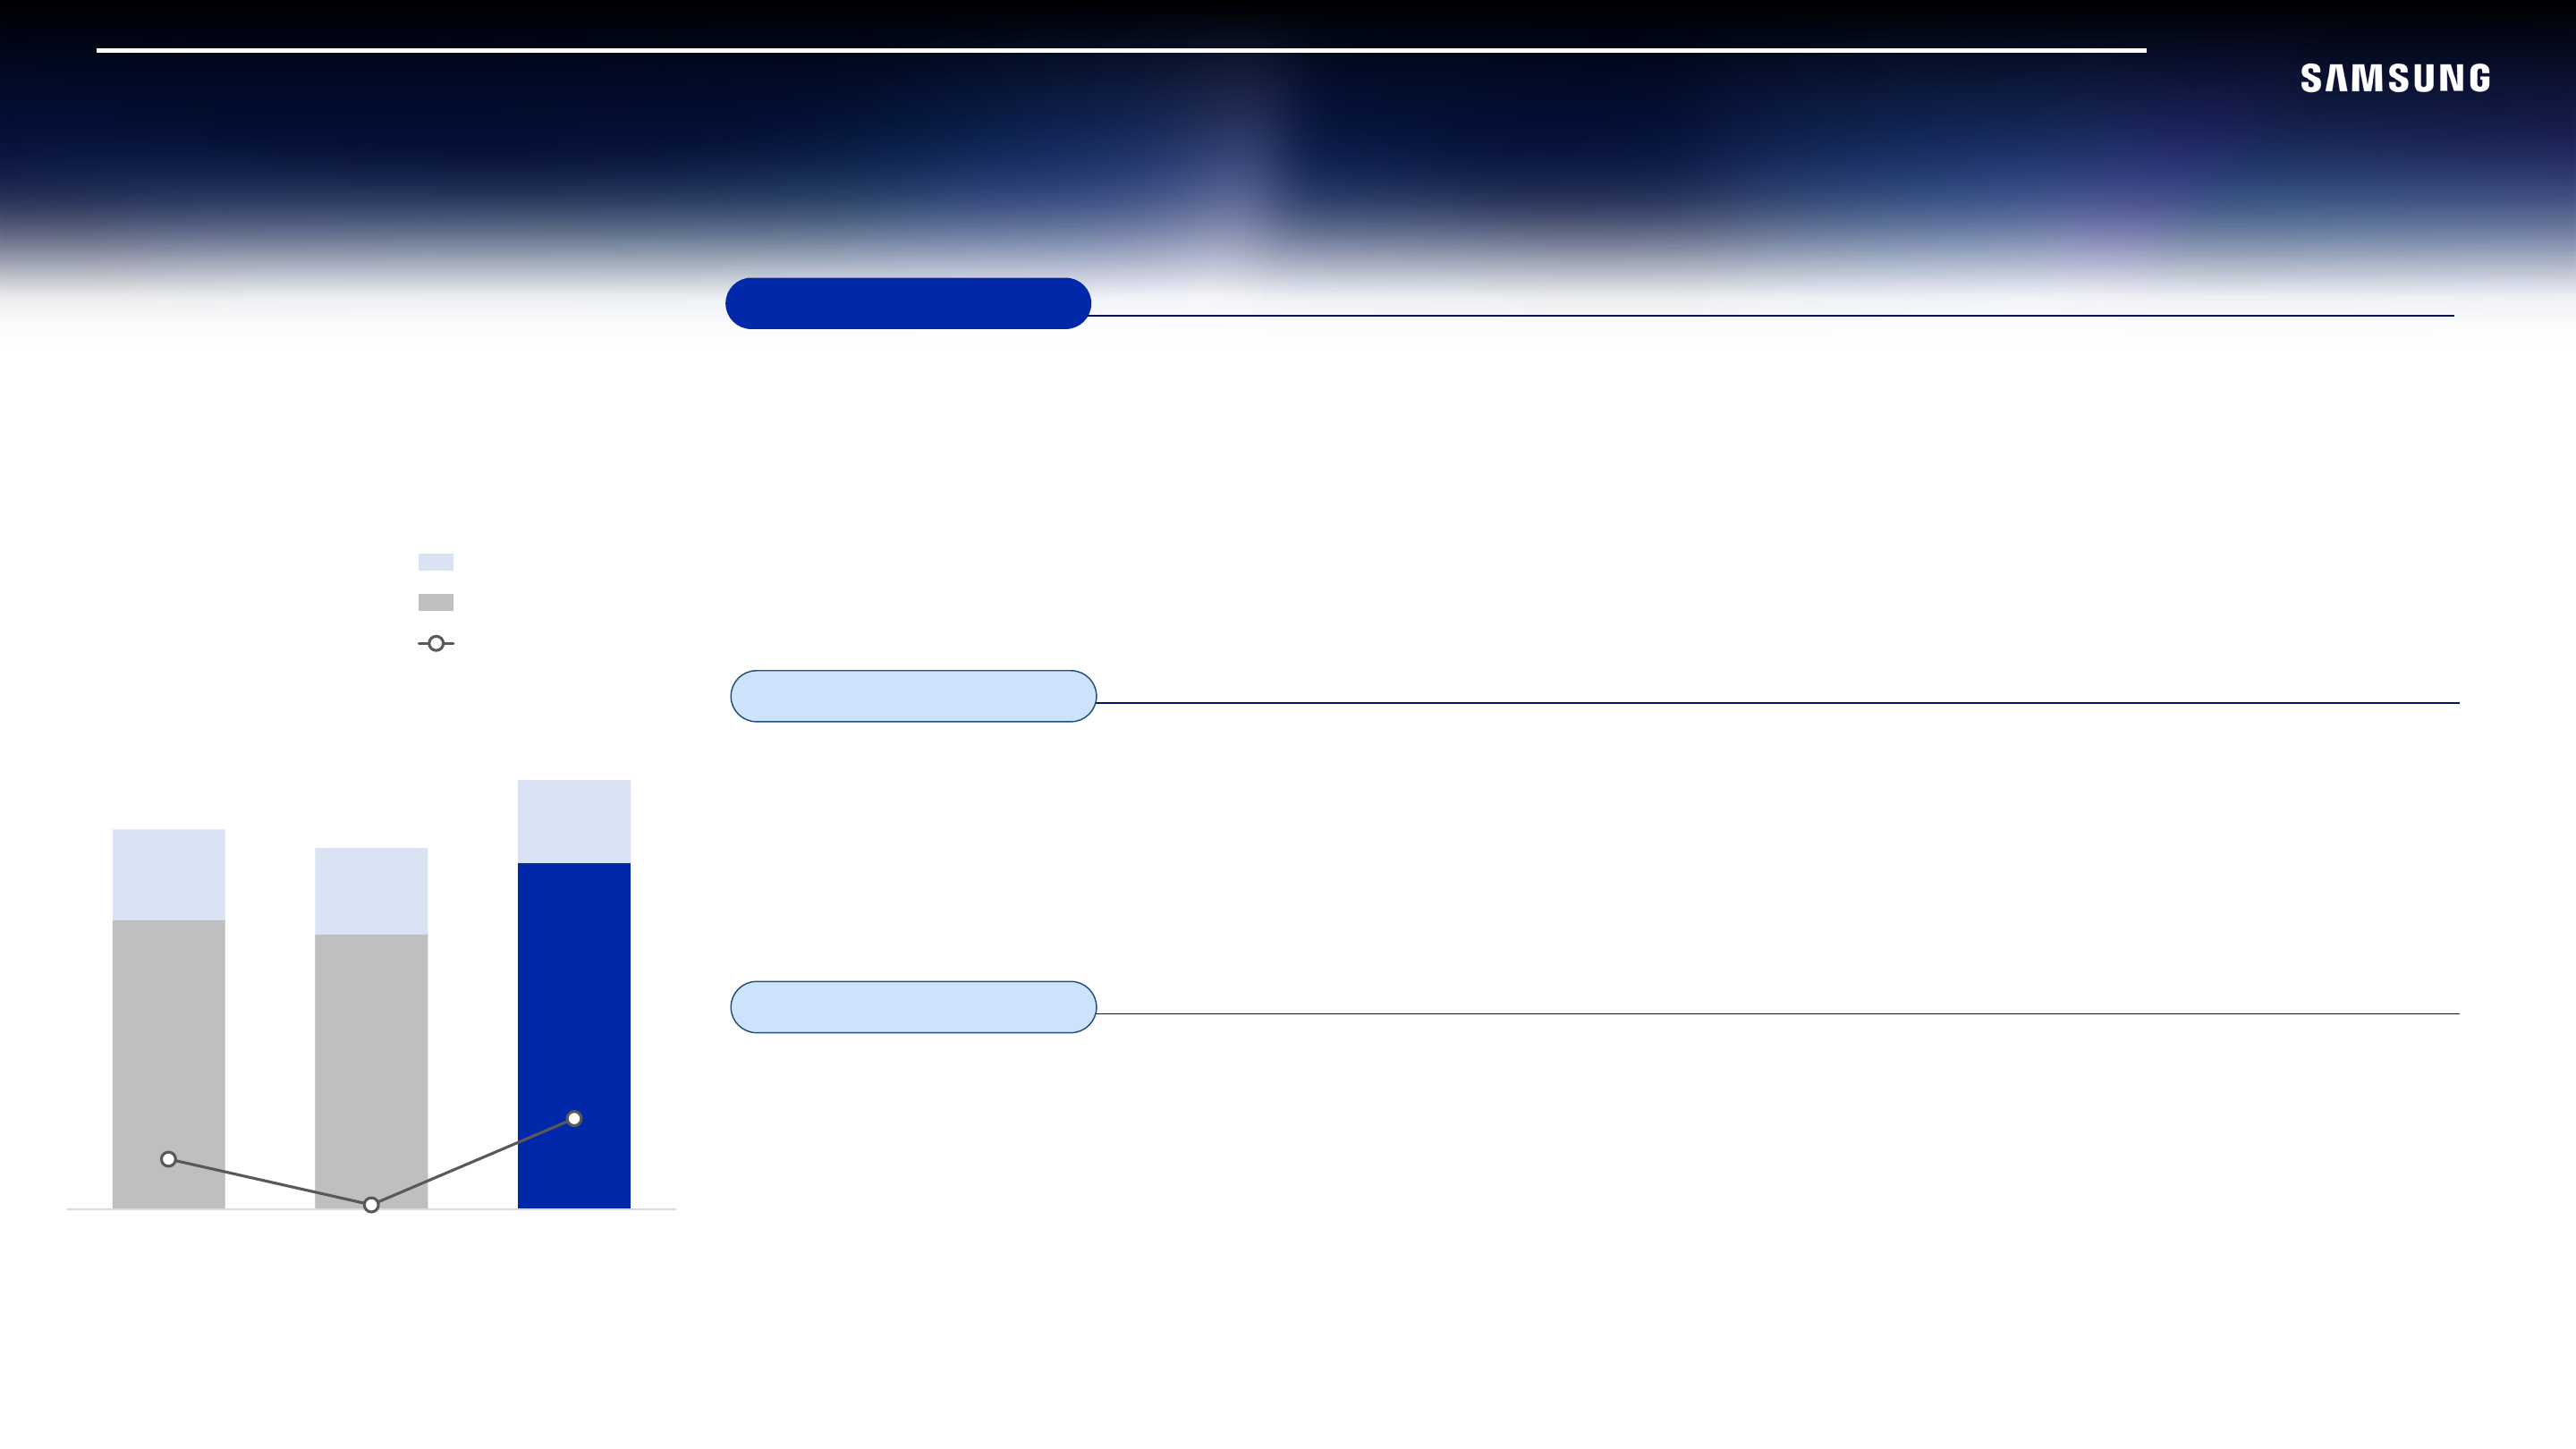
| DS Sales (KRW T) | 29.3 | 27.9 | 33.1 |
| Memory Sales (KRW T) | 22.3 | 21.2 | 26.7 |
| Operating Profit (KRW T) | 3.9 | 0.4 | 7.0 |
3Q 2025 Results
Achieved Record-High Quarterly Revenue
- Sequentially expanded HBM3E sales in line with strong AI demand
- Proactively addressed strong demand across all applications
Significantly Improved Profit
- Enhanced profitability amid market price increase
- Sequential profit increase partially attributable to reduced one-time inventory value adjustments
4Q 2025 Outlook
Actively Respond to AI/Conventional Server Demand
- Cater to market needs with HBM3E, high-density eSSD, and other leading-edge products
Expand Sales of High-Value-Added Server Memory
- Utilize diverse high-performance products, such as industry-leading 128GB↑ DDR5, 24Gb GDDR7, etc.
2026 Outlook
Strategic Focus on HBM
- Prioritize the expansion of HBM4 business with differentiated performance to address increasing AI demand
- Aim to broaden HBM sales base to strengthen position in HBM market
Concentrate on High-Value-Added Product Sales
- Seek to expand AI-related product sales with DDR5, LPDDR5x, high-density QLC SSD, etc.
S.LSI / Foundry
DS results
KRW trillion
| 3Q24 | 2Q25 | 3Q25 | |
|---|---|---|---|
| DS Sales (KRW T) | 29.3 | 27.9 | 33.1 |
3Q 2025 Results
S.LSI
- Maintained stable supply of premium SoCs
- Earnings stalled due to seasonality and customer inventory adjustments
Foundry
- Achieved record-high customer orders mainly on advanced nodes
- Started mass production of GAA 1st Gen. 2nm process
- Earnings improved substantially as one-off costs subsided and fab utilization improved
4Q 2025 Outlook
S.LSI
- Address ongoing weak demand from key customers by focusing on expanding sales of premium SoCs and image sensors
Foundry
- Aim for further earnings improvement through ramp-up of 2nm mass production, higher utilization, and cost optimization
2026 Outlook
S.LSI
- Strengthen Exynos competitiveness for key flagship models to secure market leadership
- Expand market presence by leveraging differentiated image sensor technologies
Foundry
- Focus on mass production of GAA 2nd Gen. 2nm process, the performance- and power- optimized 4nm, and HBM4 base-die
- Ensure timely initial operation of the Taylor Fab in the U.S.
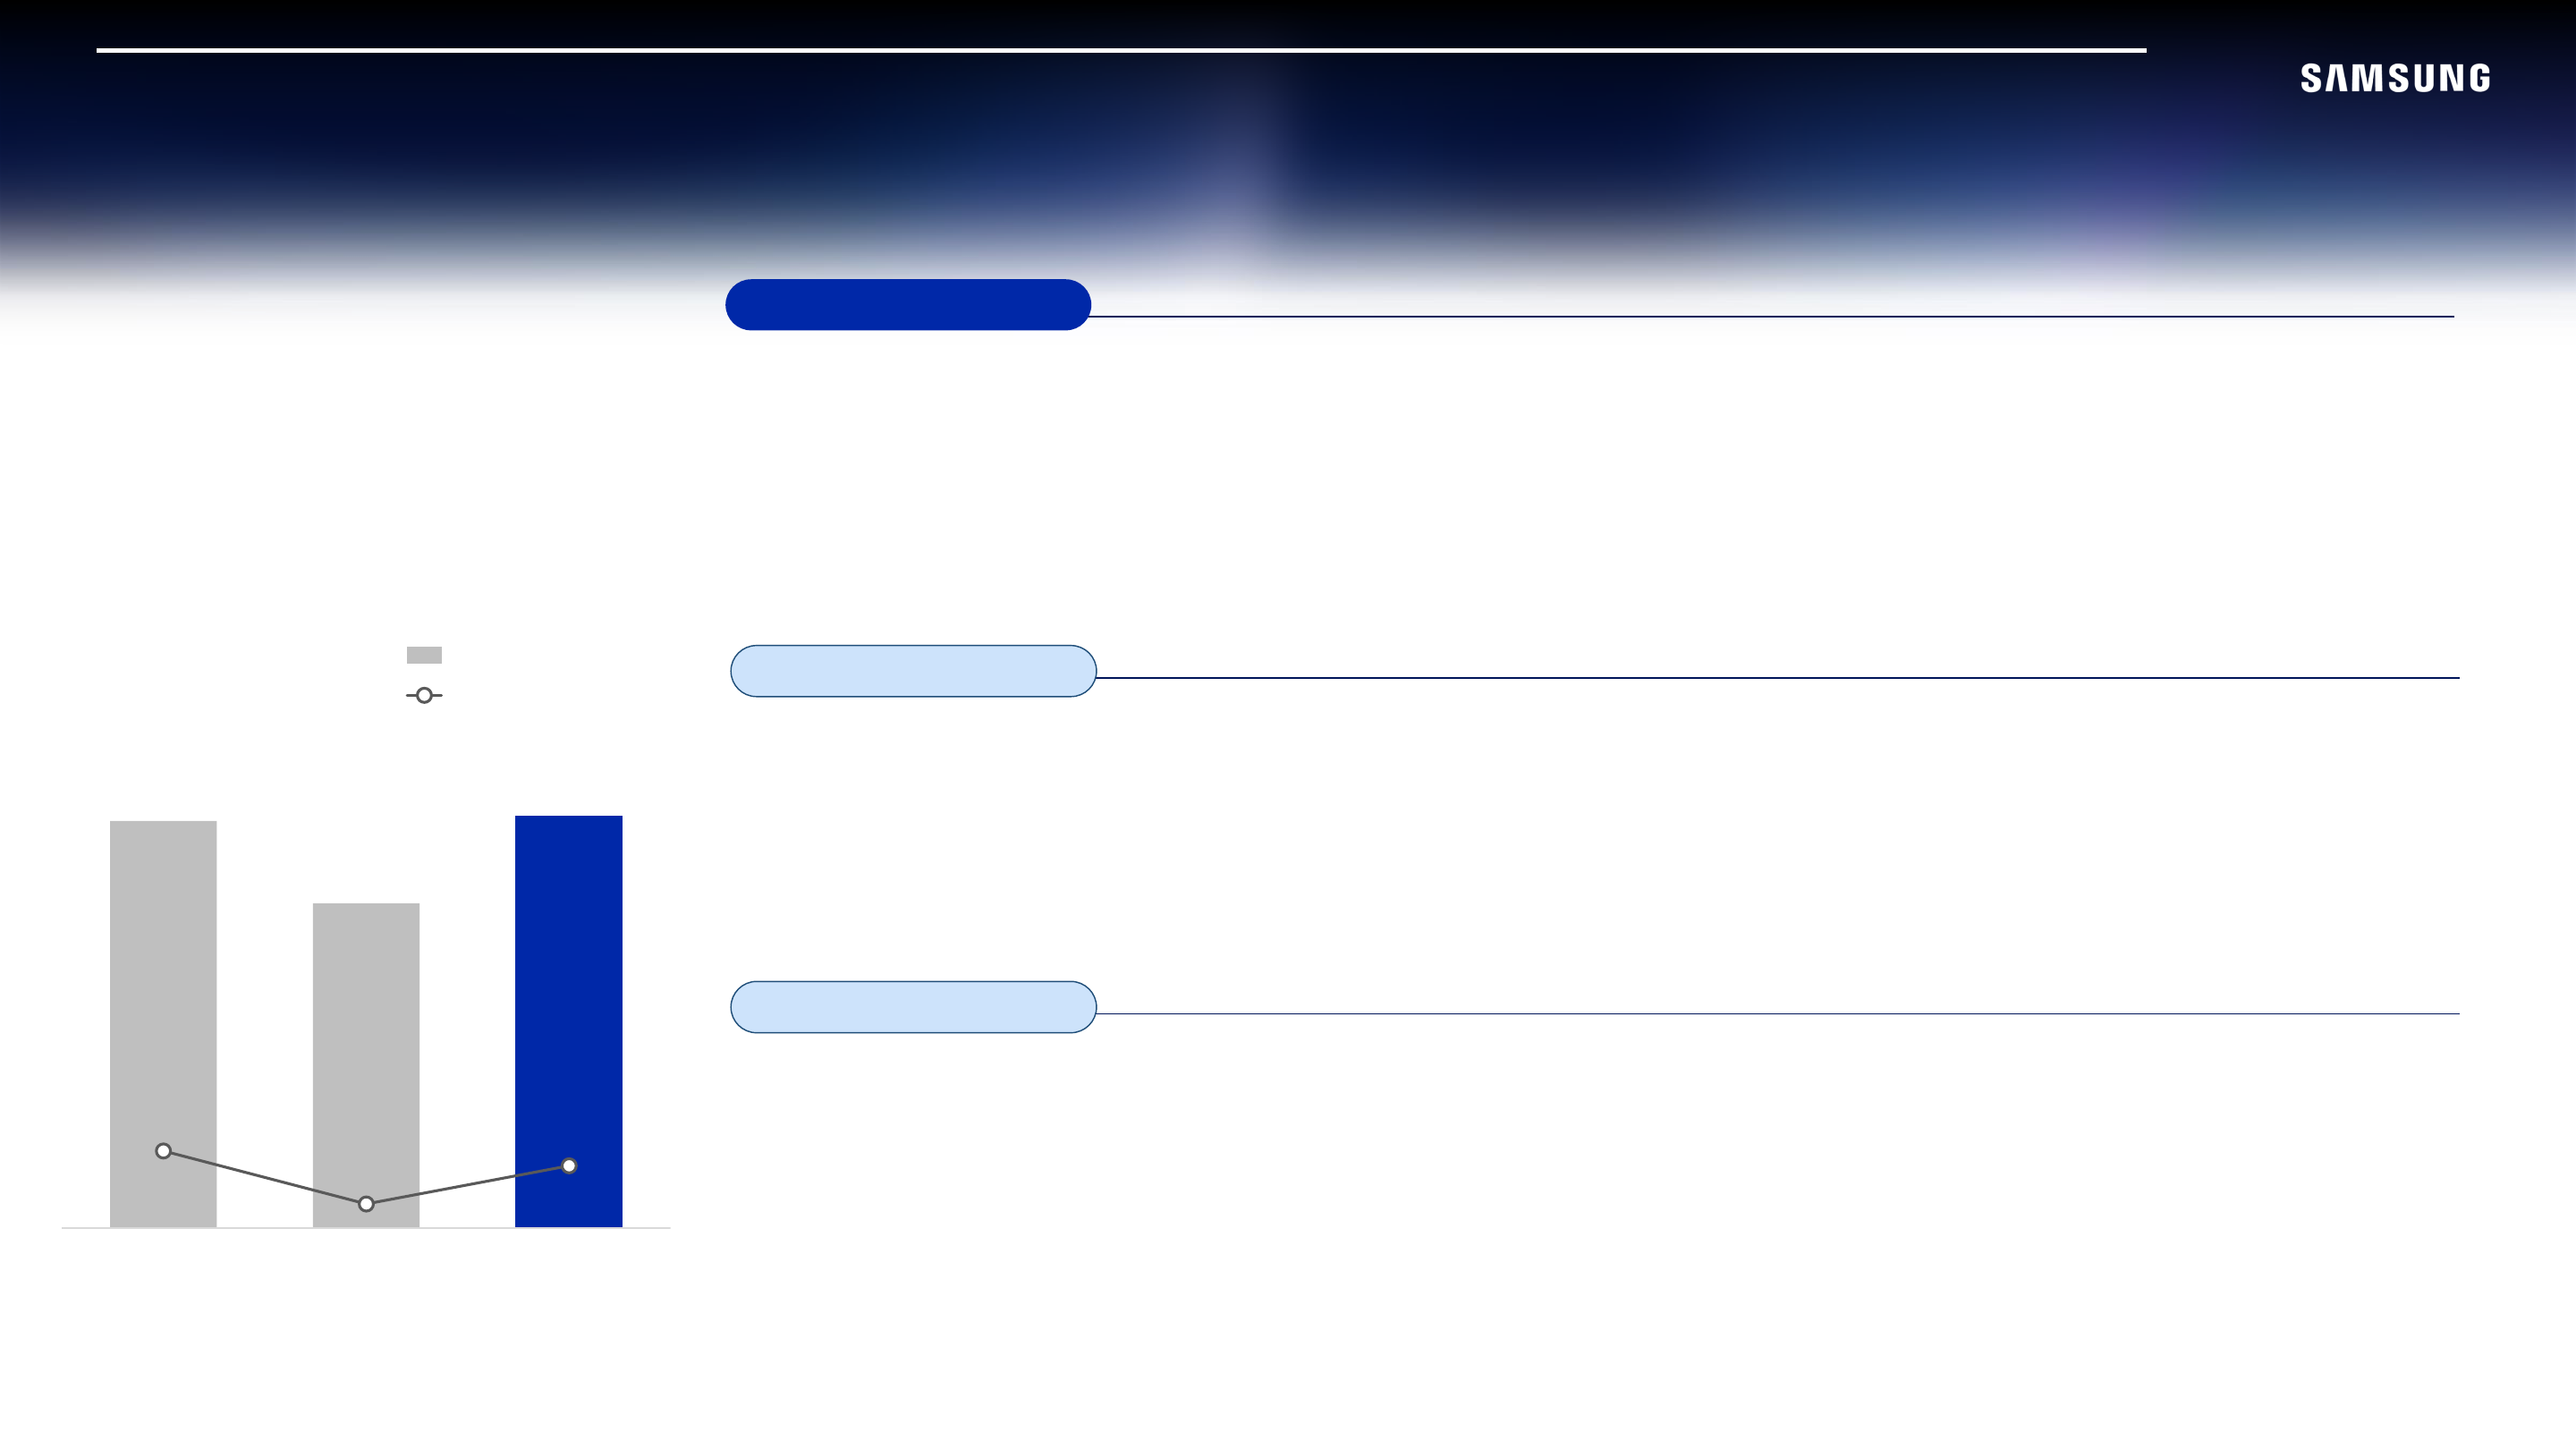
SDC (Samsung Display Corporation)
SDC results
KRW trillion
| 3Q24 | 2Q25 | 3Q25 | |
|---|---|---|---|
| Sales (KRW T) | 8.0 | 6.4 | 8.1 |
| Operating Profit (KRW T) | 1.5 | 0.5 | 1.2 |
3Q 2025 Results
Small & Medium
- Achieved improved performance driven by robust demand for flagship smartphones
- Enhanced results through proactive response to new product demand from key customers
Large
- Recorded increased unit sales, supported by the expanding demand for gaming monitors
4Q 2025 Outlook
Small & Medium
- Anticipate continued sales growth as solid demand for new smartphones persists
- Project increased sales of non-smartphone products in response to evolving market needs
Large
- Aim to drive sales through the full-scale launch of products adopting QD-OLED monitor lineup
2026 Outlook
Small & Medium
- Expand the smartphone technology gap by leveraging differentiated technologies optimized for AI devices and enhanced foldable product excellence
- Accelerate OLED expansion with competitive products through the new 8.6G IT production line
Large
- TVs: Sustain premium leadership based on superior performance
- Monitors: Reinforce market position of QD-OLED through lineup expansion and customer base diversification
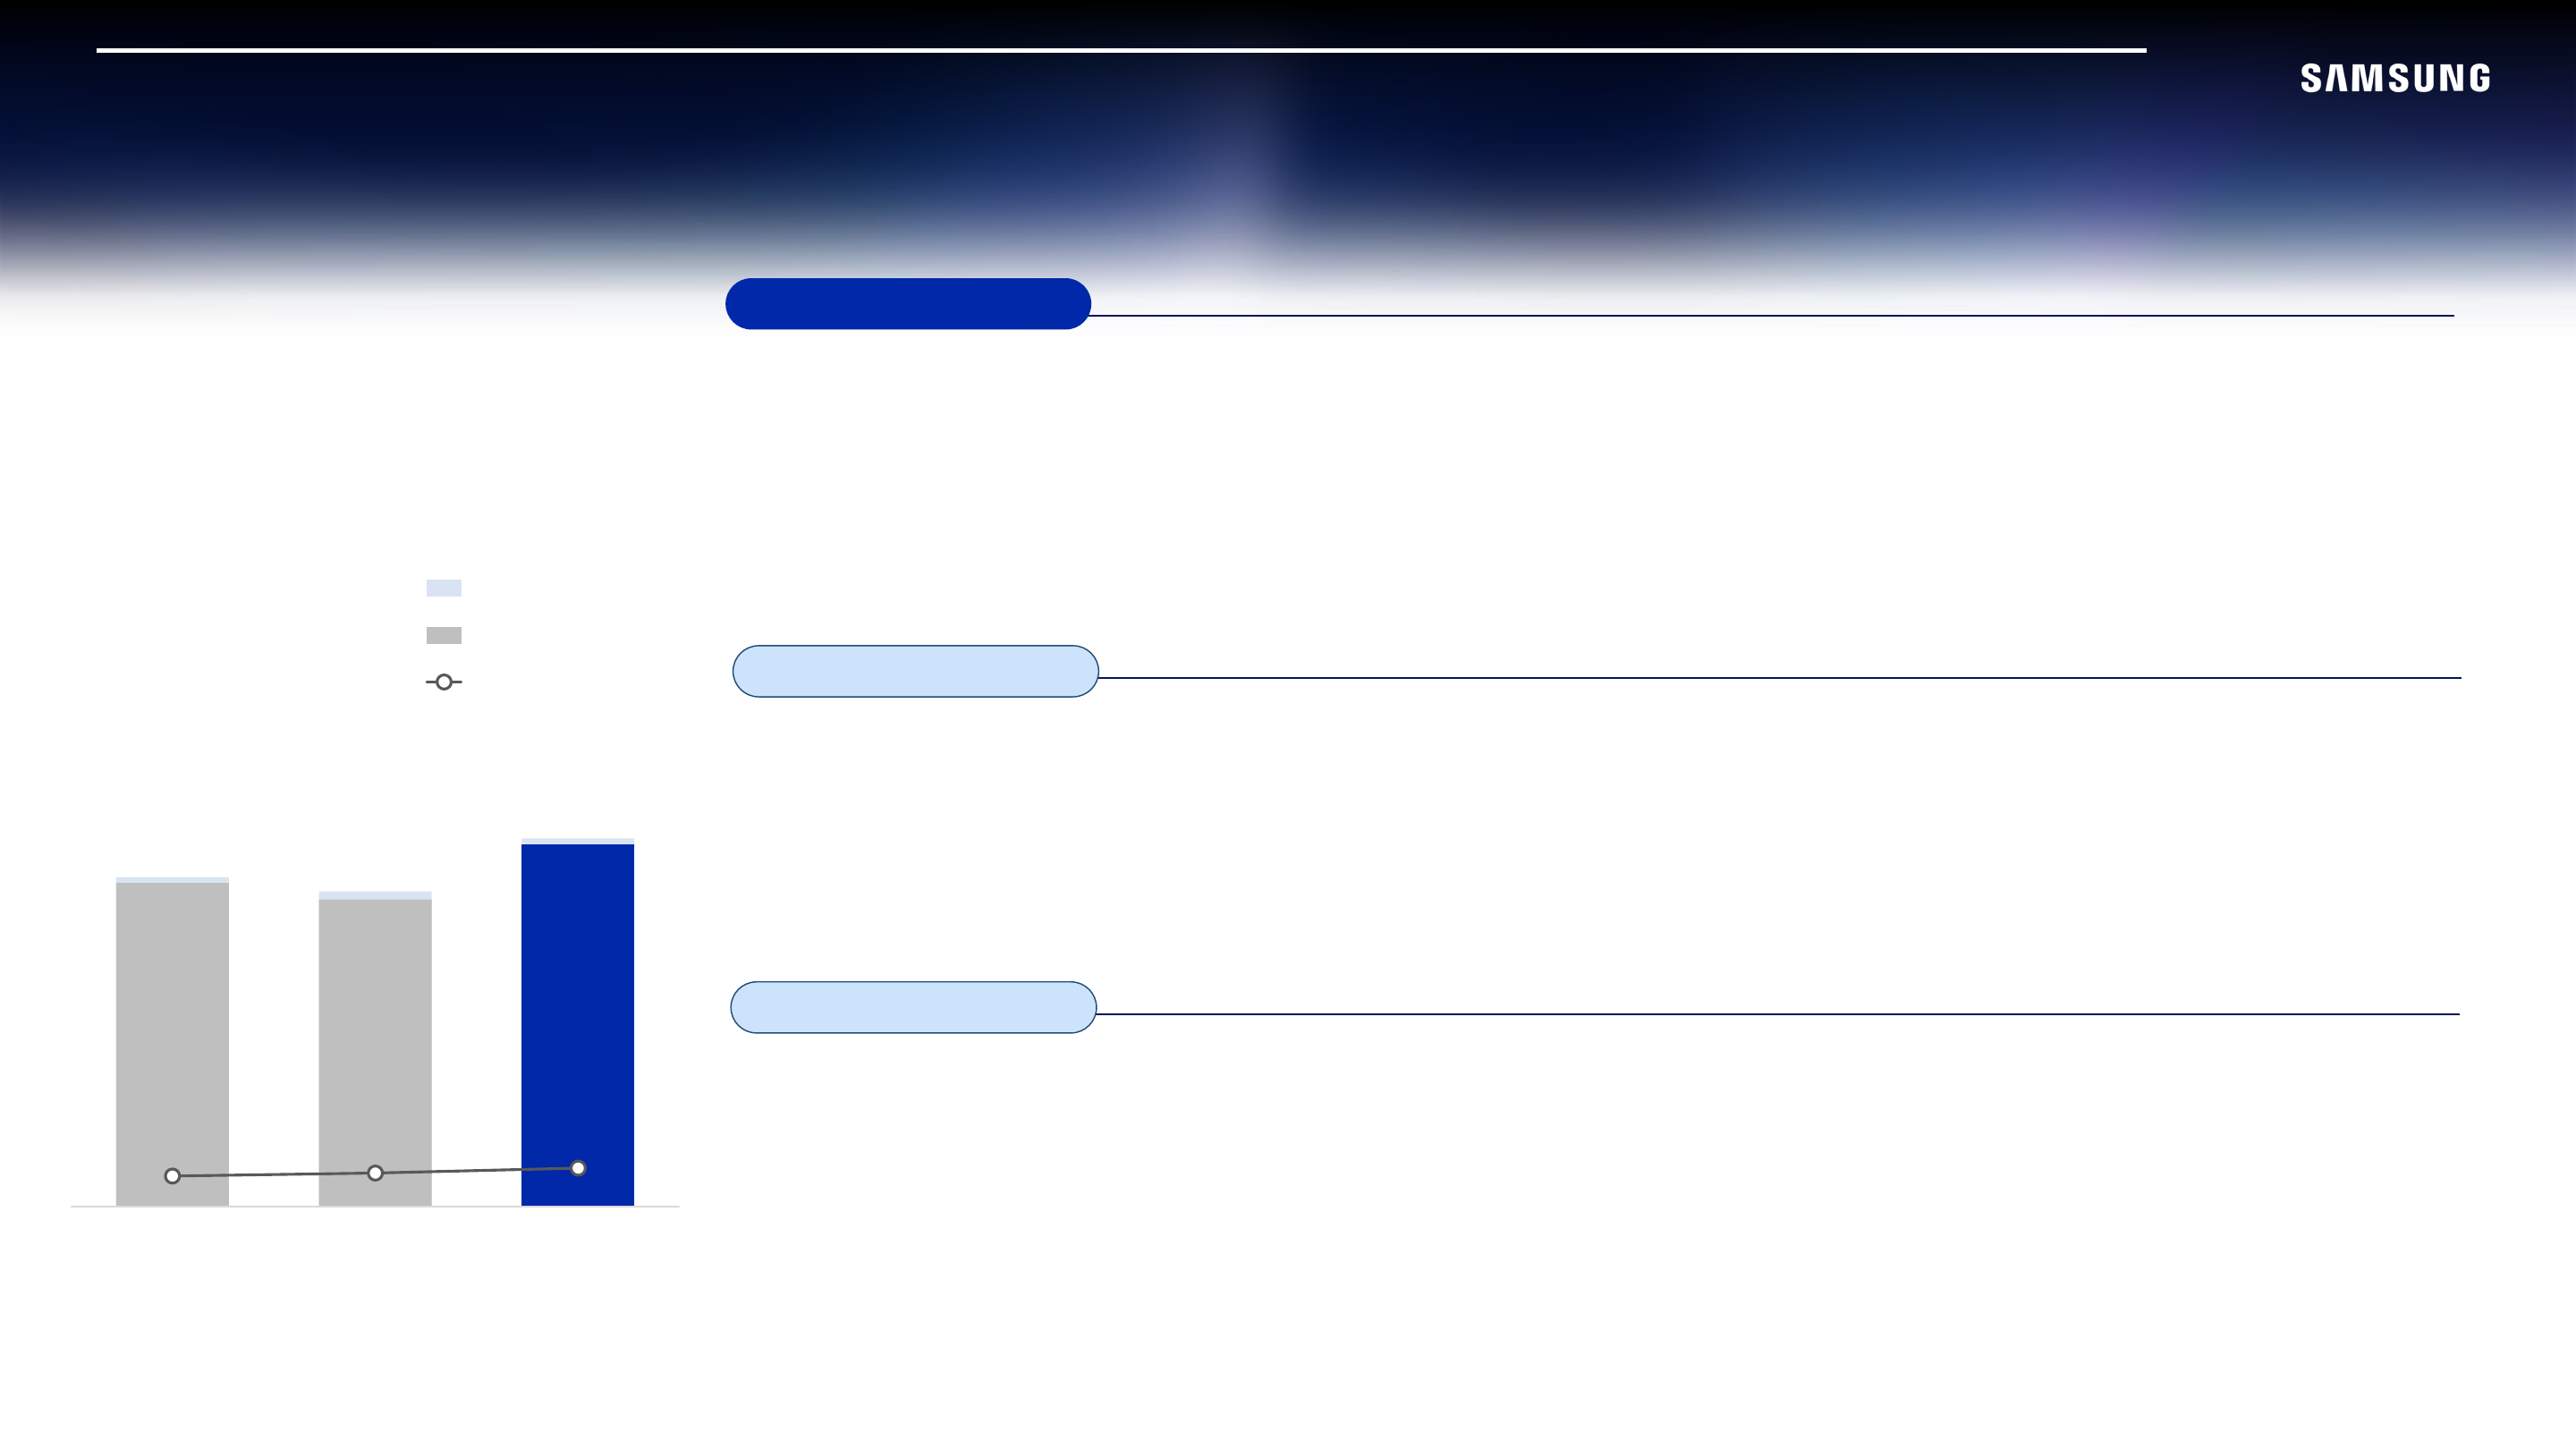
MX / NW
MX / NW results
KRW trillion
| 3Q24 | 2Q25 | 3Q25 | |
|---|---|---|---|
| MX/NW Sales (KRW T) | 30.5 | 29.2 | 34.1 |
| Operating Profit (KRW T) | 2.8 | 3.1 | 3.6 |
3Q 2025 Results
MX
- Achieved sequential and year-over-year growth in sales and operating profit, driven by the successful launch of Fold 7
- Maintained strong flagship smartphone sales momentum while improving the sales of tablets and wearables
NW
- Experienced decline in North America and domestic sales, impacting sequential performance
- Demonstrated year-over-year improvement, supported by the base effect
4Q 2025 Outlook
MX
- Aim for year-over-year growth by leveraging seasonal promotions of AI smartphones, including S25 and foldables
- Strengthen ecosystem device sales, focusing on new premium models
NW
- Anticipate sequential and year-over-year improvements through expanded sales in key markets, such as North America
2026 Outlook
MX
- Reinforce AI leadership through innovative form factor designs and next generation AI experiences
- Expand AI smartphone sales to drive growth across all market segments and solidify volume leadership
- Maintain cost efficiency by optimizing processes amid uncertainties and increasing material costs
NW
- Drive growth through equipment demand boosted by domestic spectrum auction
- Expect stable sales performance in major oversea customers
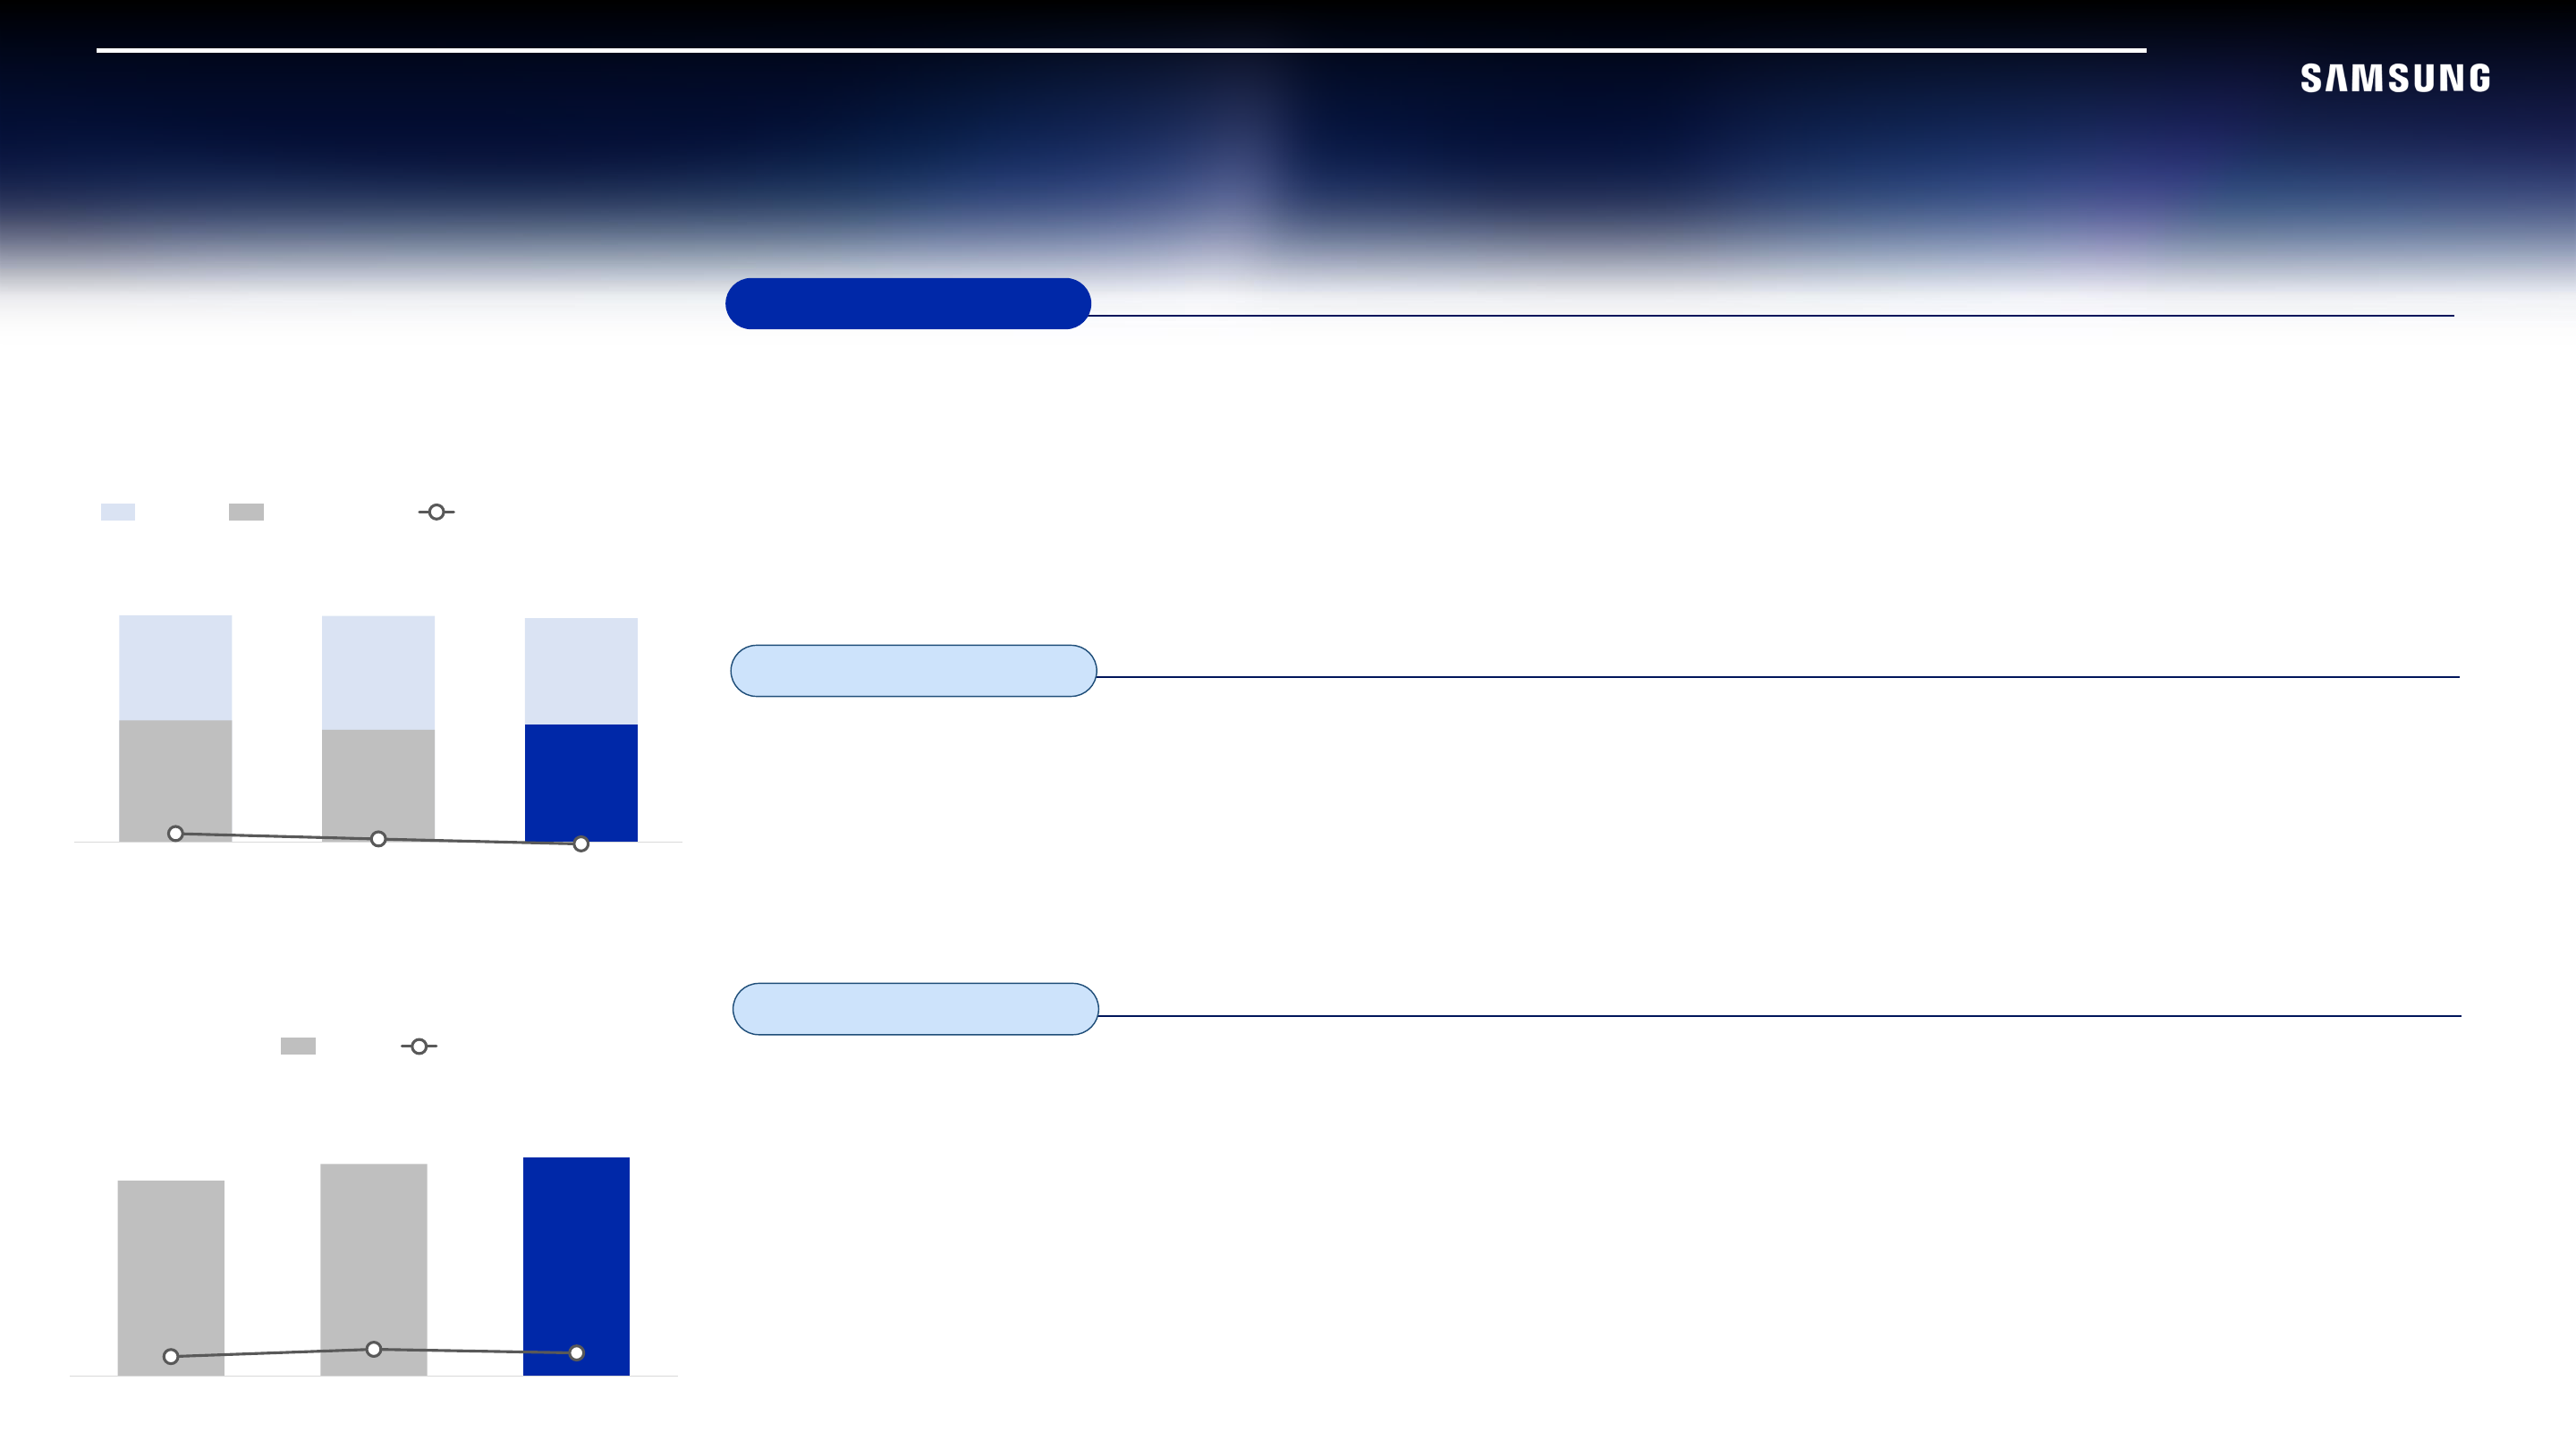
VD / DA / Harman
VD/DA results
KRW trillion
| 3Q24 | 2Q25 | 3Q25 | |
|---|---|---|---|
| VD/DA Sales (KRW T) | 14.1 | 14.1 | 13.9 |
| VD Sales (KRW T) | 7.6 | 7.0 | 7.3 |
| Operating Profit (KRW T) | 0.5 | 0.2 | (0.1) |
Harman results
KRW trillion
| 3Q24 | 2Q25 | 3Q25 | |
|---|---|---|---|
| Harman Sales (KRW T) | 3.5 | 3.8 | 4.0 |
| Operating Profit (KRW T) | 0.4 | 0.5 | 0.4 |
3Q 2025 Results
VD
- Experienced decline in earnings due to heightened market competition, despite solid sales of premium products
DA
- Earnings decreased amid seasonally low air conditioner (AC) demand and the impact of U.S. tariffs
Harman
- Achieved revenue growth driven by increased sales in both consumer audio and automotive segments
4Q 2025 Outlook
VD
- Drive revenue recovery by proactively capturing seasonal demand through enhanced sales programs focused on premium and large-screen TVs
DA
- Aim for YoY sales growth by prioritizing premium product expansion amid market uncertainties, including tariffs
Harman
- Target YoY sales growth by boosting audio sales during peak season and diversifying brand portfolio
2026 Outlook
VD
- Reinforce premium market leadership through innovative products like Micro RGB
- Drive revenue growth by expanding sales in low-end to mid-range segments
DA
- Expand sales by enhancing AI features and strengthening competitiveness in high-volume segments
- Optimize business structure by shifting towards high-value-added areas, such as HVAC
Harman
- Sustain growth in the automotive business by diversifying customer base
- Solidify audio market leadership by leveraging newly acquired brands to enhance market presence
Appendix 1: Financial Position (Summary)
| KRW billion | 30.Sep.24 | 30.Jun.25 | 30.Sep.25 |
|---|---|---|---|
| Assets | 491,307.3 | 504,875.2 | 523,659.6 |
| Cash ※ | 103,776.5 | 100,728.2 | 108,463.8 |
| A/R | 44,692.0 | 43,550.5 | 50,538.8 |
| Inventories | 53,356.8 | 51,037.4 | 50,332.4 |
| Investments | 31,914.6 | 33,240.3 | 38,345.3 |
| PP&E | 195,028.8 | 205,025.6 | 204,861.1 |
| Intangible assets | 23,077.5 | 25,997.7 | 26,469.1 |
| Other assets | 39,461.1 | 45,295.5 | 44,649.1 |
| Total assets | 491,307.3 | 504,875.2 | 523,659.6 |
| Liabilities | 105,025.9 | 105,313.2 | 110,158.1 |
| Debts | 16,931.9 | 14,029.7 | 16,672.3 |
| Trade accounts and N/P | 12,861.8 | 12,675.8 | 14,417.4 |
| Other accounts and N/P & accrued expenses | 44,485.7 | 42,922.0 | 43,313.5 |
| Current income tax liabilities | 4,882.4 | 7,643.1 | 6,189.6 |
| Unearned revenue & other advances | 2,595.4 | 2,620.2 | 2,953.8 |
| Other liabilities | 23,268.7 | 25,422.4 | 26,611.5 |
| Shareholder equity | 386,281.4 | 399,562.0 | 413,501.5 |
| Capital stock | 897.5 | 897.5 | 897.5 |
| Total liability & Shareholder equity | 491,307.3 | 504,875.2 | 523,659.6 |
| 30.Sep.24 | 30.Jun.25 | 30.Sep.25 | |
|---|---|---|---|
| Current ratio ※ | 252% | 251% | 263% |
| Liability/equity | 27% | 26% | 27% |
| Debt/equity | 4% | 4% | 4% |
| Net debt/equity | (22%) | (22%) | (22%) |
※ Cash = Cash and Cash equivalents Short-term financial instruments Short-term financial assets at amortized cost etc. ※ Current ratio = current assets/current liabilities
Appendix 2: Cash Flow (Summary)
| KRW trillion | 3Q24 | 2Q25 | 3Q25 |
|---|---|---|---|
| Cash (beginning of period) ※ | 100.80 | 105.13 | 100.73 |
| Cash flows from operating activities | 22.20 | 17.31 | 22.62 |
| Net profit | 10.10 | 5.12 | 12.23 |
| Depreciation | 10.31 | 10.56 | 10.96 |
| Cash flows from investing activities | (14.30) | (13.35) | (13.04) |
| Purchase of PP&E | (10.96) | (13.04) | (10.81) |
| Cash flows from financing activities | (2.18) | (3.41) | (4.19) |
| Increase in debts | 0.28 | 2.82 | 2.15 |
| Acquisition of treasury stock | - | (1.32) | (3.87) |
| Payment of dividends | (2.45) | (4.90) | (2.46) |
| Increase in cash | 2.98 | (4.41) | 7.74 |
| Cash (end of period) ※ | 103.78 | 100.73 | 108.46 |
※ Cash = Cash and cash equivalents short-term financial instruments short-term financial assets at amortized cost etc.
Current State of Net Cash (Net Cash = Cash ※ - Debts)
| KRW trillion | 30.Sep.24 | 30.Jun.25 | 30.Sep.25 |
|---|---|---|---|
| Net Cash | 86.84 | 86.70 | 91.79 |
※ Cash = Cash and cash equivalents short-term financial instruments short-term financial assets at amortized cost etc.