
Robinhood Markets, Inc.
Earnings Presentation Fourth Quarter 2025
February 10, 2026

Disclaimers
This Presentation Relates to Robinhood's Broader Earnings Announcement Disclosures
This presentation accompanies the fourth quarter and full year 2025 earnings announcement webcast of Robinhood Markets, Inc. (including its consolidated subsidiaries, "we," "Robinhood," or the "Company") and should be read together with Robinhood's earnings announcement press release. Hyperlinks to our fourth quarter and full year 2025 webcast, and press release can be found together with these slides on Robinhood's investor relations website at investors.robinhood.com.
Key Performance Metrics
This presentation includes key performance metrics that our management uses to help evaluate our business, identify trends affecting our business, formulate business plans, and make strategic decisions. Our key performance metrics include Funded Customers, Total Platform Assets, Net Deposits, Average Revenue Per User ("ARPU"), and Robinhood Gold Subscribers. Definitions of performance metrics can be found in the appendix to this presentation (the "Appendix").
Non-GAAP Financial Measures and Where to Find Reconciliations to GAAP
This presentation includes financial measures that were not prepared in accordance with U.S. generally accepted accounting principles ("GAAP"). Our non-GAAP financial measures include adjusted earnings before interest, taxes, depreciation, and amortization ("Adjusted EBITDA"), Adjusted EBITDA Margin, Incremental Adjusted EBITDA Margin, Adjusted Operating Expenses, Adjusted Operating Expenses and SBC, Adjusted Operating Expenses and SBC excluding the 2021 Founders Award Cancellation, Q4 2024 Net Income Prior to Tax Benefit and Regulatory Accrual Reversal, and Q4 2024 EPS Prior to Tax Benefit and Regulatory Accrual Reversal. Definitions, explanations, and reconciliations to the most comparable GAAP financial measures can be found in the Appendix.
Cautionary Note Regarding Forward-Looking Statements
This presentation and the related webcast contain forward-looking statements regarding our expected financial performance and our strategic and operational plans, including (among others) statements regarding that Robinhood Social is rolling out early 2026, Robinhood Cortex indicators and scanners on Robinhood Legend are rolling out early 2026 to Gold Subscribers, overnight index options are rolling out early 2026, custom combos are rolling out early 2026, and Cortex Assistant is rolling out early 2026 to Gold Subscribers; that Robinhood Ventures is a broader initiative that Robinhood is planning to launch to give retail investors exposure to private companies; that Robinhood is coming to Indonesia; that our pending acquisitions of PT Buana Capital Sekuritas and PT Pedagang Aset Kripto are expected to close in the first half of 2026; our 10 Year Vision, including our plans to be #1 in Active Traders, #1 in Wallet Share for the Next Generation and #1 Global Financial Ecosystem and how we plan to do so; that Stock and Crypto Digests, Portfolio Digests, and Trade Builder are coming soon; that we anticipate diluted share count will be roughly flat in 2026; that with over $4B in corporate cash, investments, and stablecoin, we are well positioned to continue deploying capital; that we believe the strength of our balance sheet gives us the flexibility to run our business while investing for future growth; that we will continue to look to drive growth and shareholder value by allocating capital across organic growth, M&A, and shareholder returns; that we continue to repurchase shares in Q1, with flexibility to accelerate if market conditions warrant; that the majority of the remaining Gold deposit boosts earned by customers prior to the end of the program will be paid out over a period of 10 months; that we plan to more than double the amount of customers with Gold Cards this year to over one million by the end of the year; that, with respect to Global Financial Ecosystem, we're excited to watch these businesses scale as we launch in new jurisdictions and round out the product offerings and think in a few years we'll look back and have really underestimated how big our international offering can be; that we've got a lot of headroom here as our customers grow faster than the industry, and we continue to deliver new products and capabilities; that our business continues to diversify with several more making great progress toward achieving over $100 million in annualized revenue, including Robinhood Legend which is nearly there, the Gold Card which is on track for this year, and TradePMR, Futures, Index Options, and Robinhood Banking, which are all scaling; that in 2026 we plan to ramp up our product velocity even faster, while delivering another year of profitable growth; that there is a massive opportunity in front of us, and we see the path to compound shareholder value for years to come; that we're going to keep adding to Robinhood Gold's value proposition; that we believe shipping even more products and value to customers can deliver outsized growth for years to come; that we aim to deliver another year of 20% plus Net Deposit growth; that we're well on our way to exceed $1 trillion in assets in the coming years; that we feel confident that we can generate strong returns on our investments; that we'll continue to be lean and disciplined in the way we allocate capital and operate; that we believe that as we continue to execute, Robinhood will become increasingly synonymous with the financial services category as the finance SuperApp; that we're just at the beginning of a Prediction Markets supercycle that could drive trillions in annual volume over time; that we're going to continue to invest in Prediction Markets in 2026; that we're adding new products, account types, and capabilities, that this year you should see acceleration in app design and personalization; that Cortex Assistant and Cortex for Legend are rolling out in the coming months and scaling throughout the year; that we intend to be at the forefront of AI in trading; our expectations regarding Family Investing and private markets, which are two big strategic moves that we're making this year; that in 2026, we'll be launching our referral program for TradePMR advisors; that we believe we can be the major beneficiary of the ongoing $100 trillion-plus wealth transfer; that we've got some exciting things coming on the Family Investing front at our event in NYC; that we think private markets could become even bigger than prediction markets; that a big part of 2026 will be seizing the tokenization opportunity, which we think dovetails nicely with our DeFi work which is accelerating; that tokenization and continued expansion into new geographies with several new international markets coming later this year; that Robinhood is well positioned to lead in AI and crypto; that a lot more is coming this year for AI and we'll continue using AI and that this year, we're continuing to automate and optimize the entire engineering pipeline, from writing code, to code review, deployment, and testing; that we're making rapid progress in software engineering with respect to AI and we'll continue to saturate usage of new and improving tools, as well as continue pushing to optimize and automate the entire engineering pipeline, including coding and code review; that we're going deeper into DeFi, making improvements to Robinhood Wallet, and working hard to launch the Robinhood Chain; that you'll see us continue to push new geographies with several new international markets coming later this year and that we plan to keep making progress both in regions we've already announced and some new ones that are underway; and that we think there is an opportunity to tokenize a significant portion of what we offer our customers on the platform today; as well as all statements about our FY 2026 financial outlook. Forward-looking statements generally relate to future events or our future financial or operating performance. In some cases, you can identify forward-looking statements because they contain words such as "believe," "may," "will," "should," "expect," "plan," "anticipate," "could," "intend," "target," "project," "contemplate," "estimate," "predict," "potential," or "continue," or the negative of these words or other similar terms or expressions that concern our expectations, strategy, plans, or intentions. Our forward-looking statements are subject to a number of known and unknown risks, uncertainties, assumptions, and other factors that may cause our actual future results, performance, or achievements to differ materially from any future results expressed or implied in this presentation and the related webcast. Reported results should not be considered an indication of future performance. Factors that contribute to the uncertain nature of our forward-looking statements include, among others: our rapid and continuing expansion, including continuing to introduce new products and services on our platforms as well as geographic expansion; the difficulty of managing our business effectively, including the size of our workforce, and the risk of declining or negative growth; the fluctuations in our financial results and key metrics from quarter to quarter; our reliance on transaction-based revenue, including payment for order flow ("PFOF"), the risk of new regulation or bans on PFOF and similar practices, and the addition of our new fee-based model for cryptocurrency; our exposure to fluctuations in interest rates and rapidly changing interest rate environments; the difficulty of raising additional capital (to provide liquidity needs and support business growth and objectives) on reasonable terms, if at all; the need to maintain capital levels required by regulators and self-regulatory organizations ("SROs"); the risk that we might mishandle the cash, securities, and cryptocurrencies we hold on behalf of customers, and our exposure to liability for processing, operational, or technical errors in clearing functions; the impact of negative publicity on our brand and reputation; the risk that changes in business, economic, or political conditions that impact the global financial markets, or a systemic market event, might harm our business; our dependence on key employees and a skilled workforce; the fact that we do not wholly own or operationally control Rothera LLC, our joint venture with Susquehanna International Group, and its subsidiaries; operational and regulatory risks and expenditures prior to and following closing of our acquisitions and investments; the difficulty of complying with an extensive, complex, and changing regulatory environment, the risk of monetary and other penalties for noncompliance, and the need to adjust our business model in response to new or modified laws and regulations; the possibility of adverse developments in pending litigation and regulatory investigations; the risk that the outcome of currently ongoing and potential future regulatory enforcement actions and litigation, as well as potential changes in federal or state law, could immediately or subsequently prevent us from offering, or continuing to offer, event contracts; the effects of competition; our need to innovate and acquire or invest in new products, services, technologies and geographies in order to attract and retain customers and deepen their engagement with us in order to maintain growth; our reliance on third parties to perform some key functions and the risk that processing, operational or technological failures could impair the availability or stability of our platforms; the risk of cybersecurity incidents, theft, data breaches, and other online attacks; the difficulty of processing customer data in compliance with privacy laws; our need as a regulated financial services company to develop and maintain effective compliance and risk management infrastructures; the risks associated with incorporating artificial intelligence ("AI") technologies into some of our products and processes; the regulation, litigation, contractual, operational, and reputational risks associated with our introduction of products such as Robinhood Stock Tokens in the European Economic Area (the "EEA") and our staking services offered in the U.S.; and the risk that substantial future sales of Class A common stock in the public market, or the perception that they may occur, could cause the price of our stock to fall. Because some of these risks and uncertainties cannot be predicted or quantified and some are beyond our control, you should not rely on our forward-looking statements as predictions of future events. More information about potential risks and uncertainties that could affect our business and financial results can be found in Part II, Item 1A of our Quarterly Report on Form 10-Q for the quarter ended September 30, 2025, as well as in our other filings with the U.S. Securities and Exchange Commission ("SEC"), all of which are available on the SEC's web site at www.sec.gov. Moreover, we operate in a very competitive and rapidly changing environment; new risks and uncertainties may emerge from time to time, and it is not possible for us to predict all risks nor identify all uncertainties. The events and circumstances reflected in our forward-looking statements might not be achieved and actual results could differ materially from those projected in the forward-looking statements. Except as otherwise noted, all forward-looking statements in this presentation and the related webcast are made as of the date of this presentation and the related webcast, February 10, 2026, and are based on information and estimates available to us at this time. Although we believe that the expectations reflected in our forward-looking statements are reasonable, we cannot guarantee future results, performance, or achievements. Except as required by law, Robinhood assumes no obligation to update any of the statements in this presentation and the related webcast whether as a result of any new information, future events, changed circumstances, or otherwise. You should view this presentation and the related webcast with the understanding that our actual future results, performance, events, and circumstances might be materially different from what we expect. All fourth quarter and full year 2025 financial information in this presentation is preliminary, based on our estimates and subject to completion of our financial closing procedures. Final results for the full year, which will be reported in our Annual Report on Form 10-K for the year ended December 31, 2025, may vary from the information in this presentation. In particular, until our financial statements are issued in our Annual Report on Form 10-K, we may be required to recognize certain subsequent events (such as in connection with contingencies or the realization of assets) which could affect our final results.
Trademarks
"Robinhood" and the Robinhood feather logo are registered trademarks of Robinhood Markets, Inc. All other names are trademarks and/or registered trademarks of their respective owners.
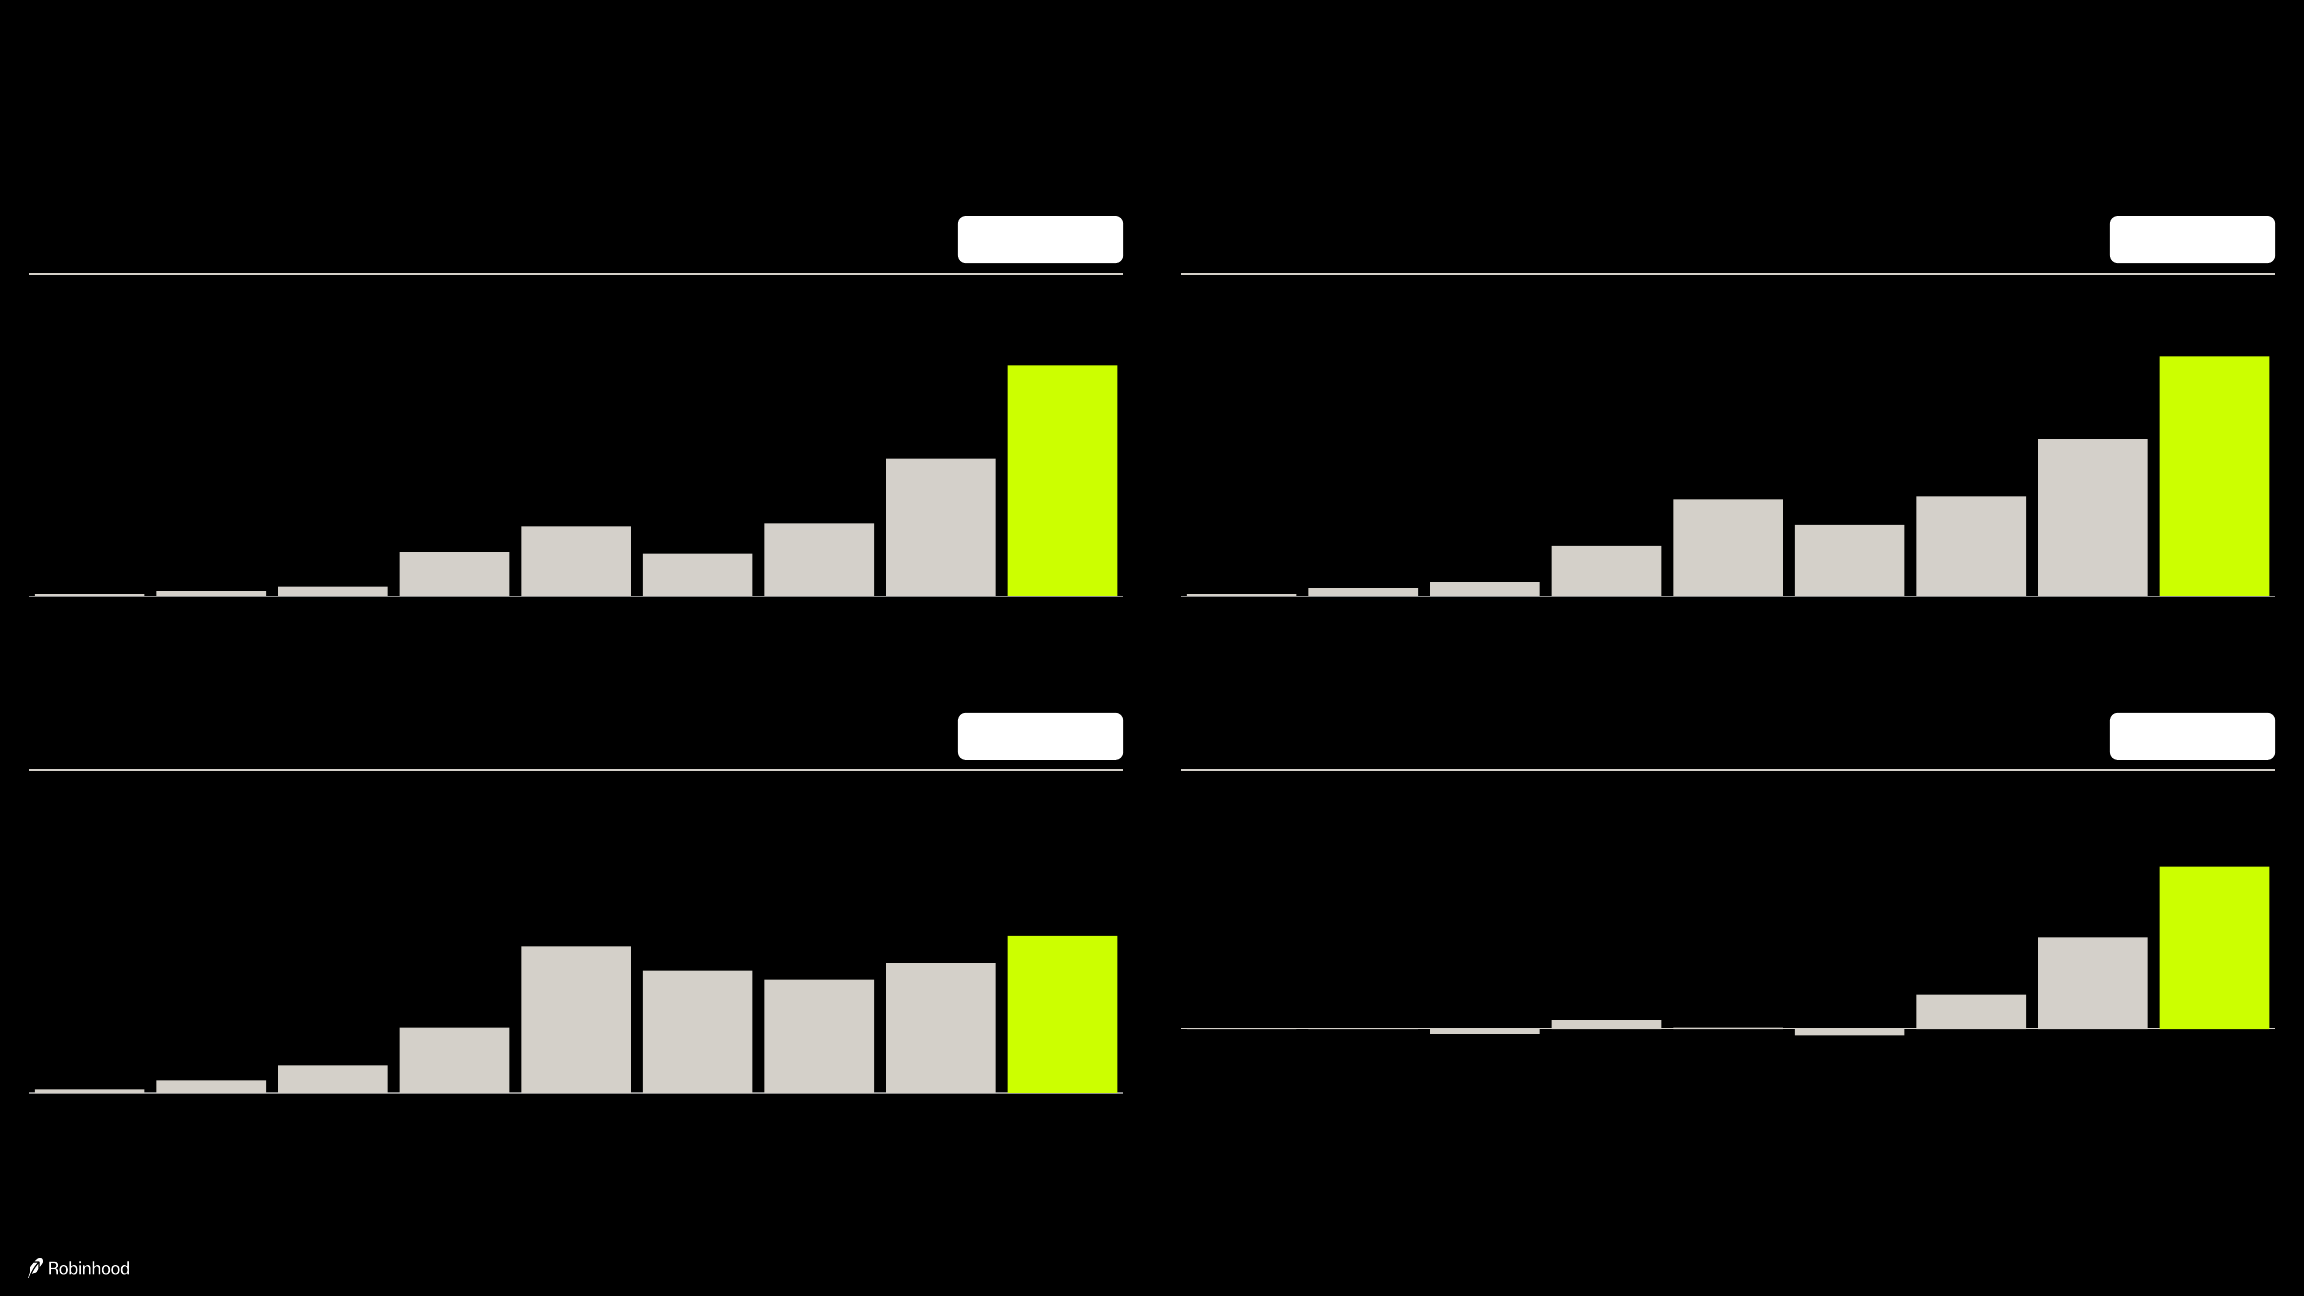
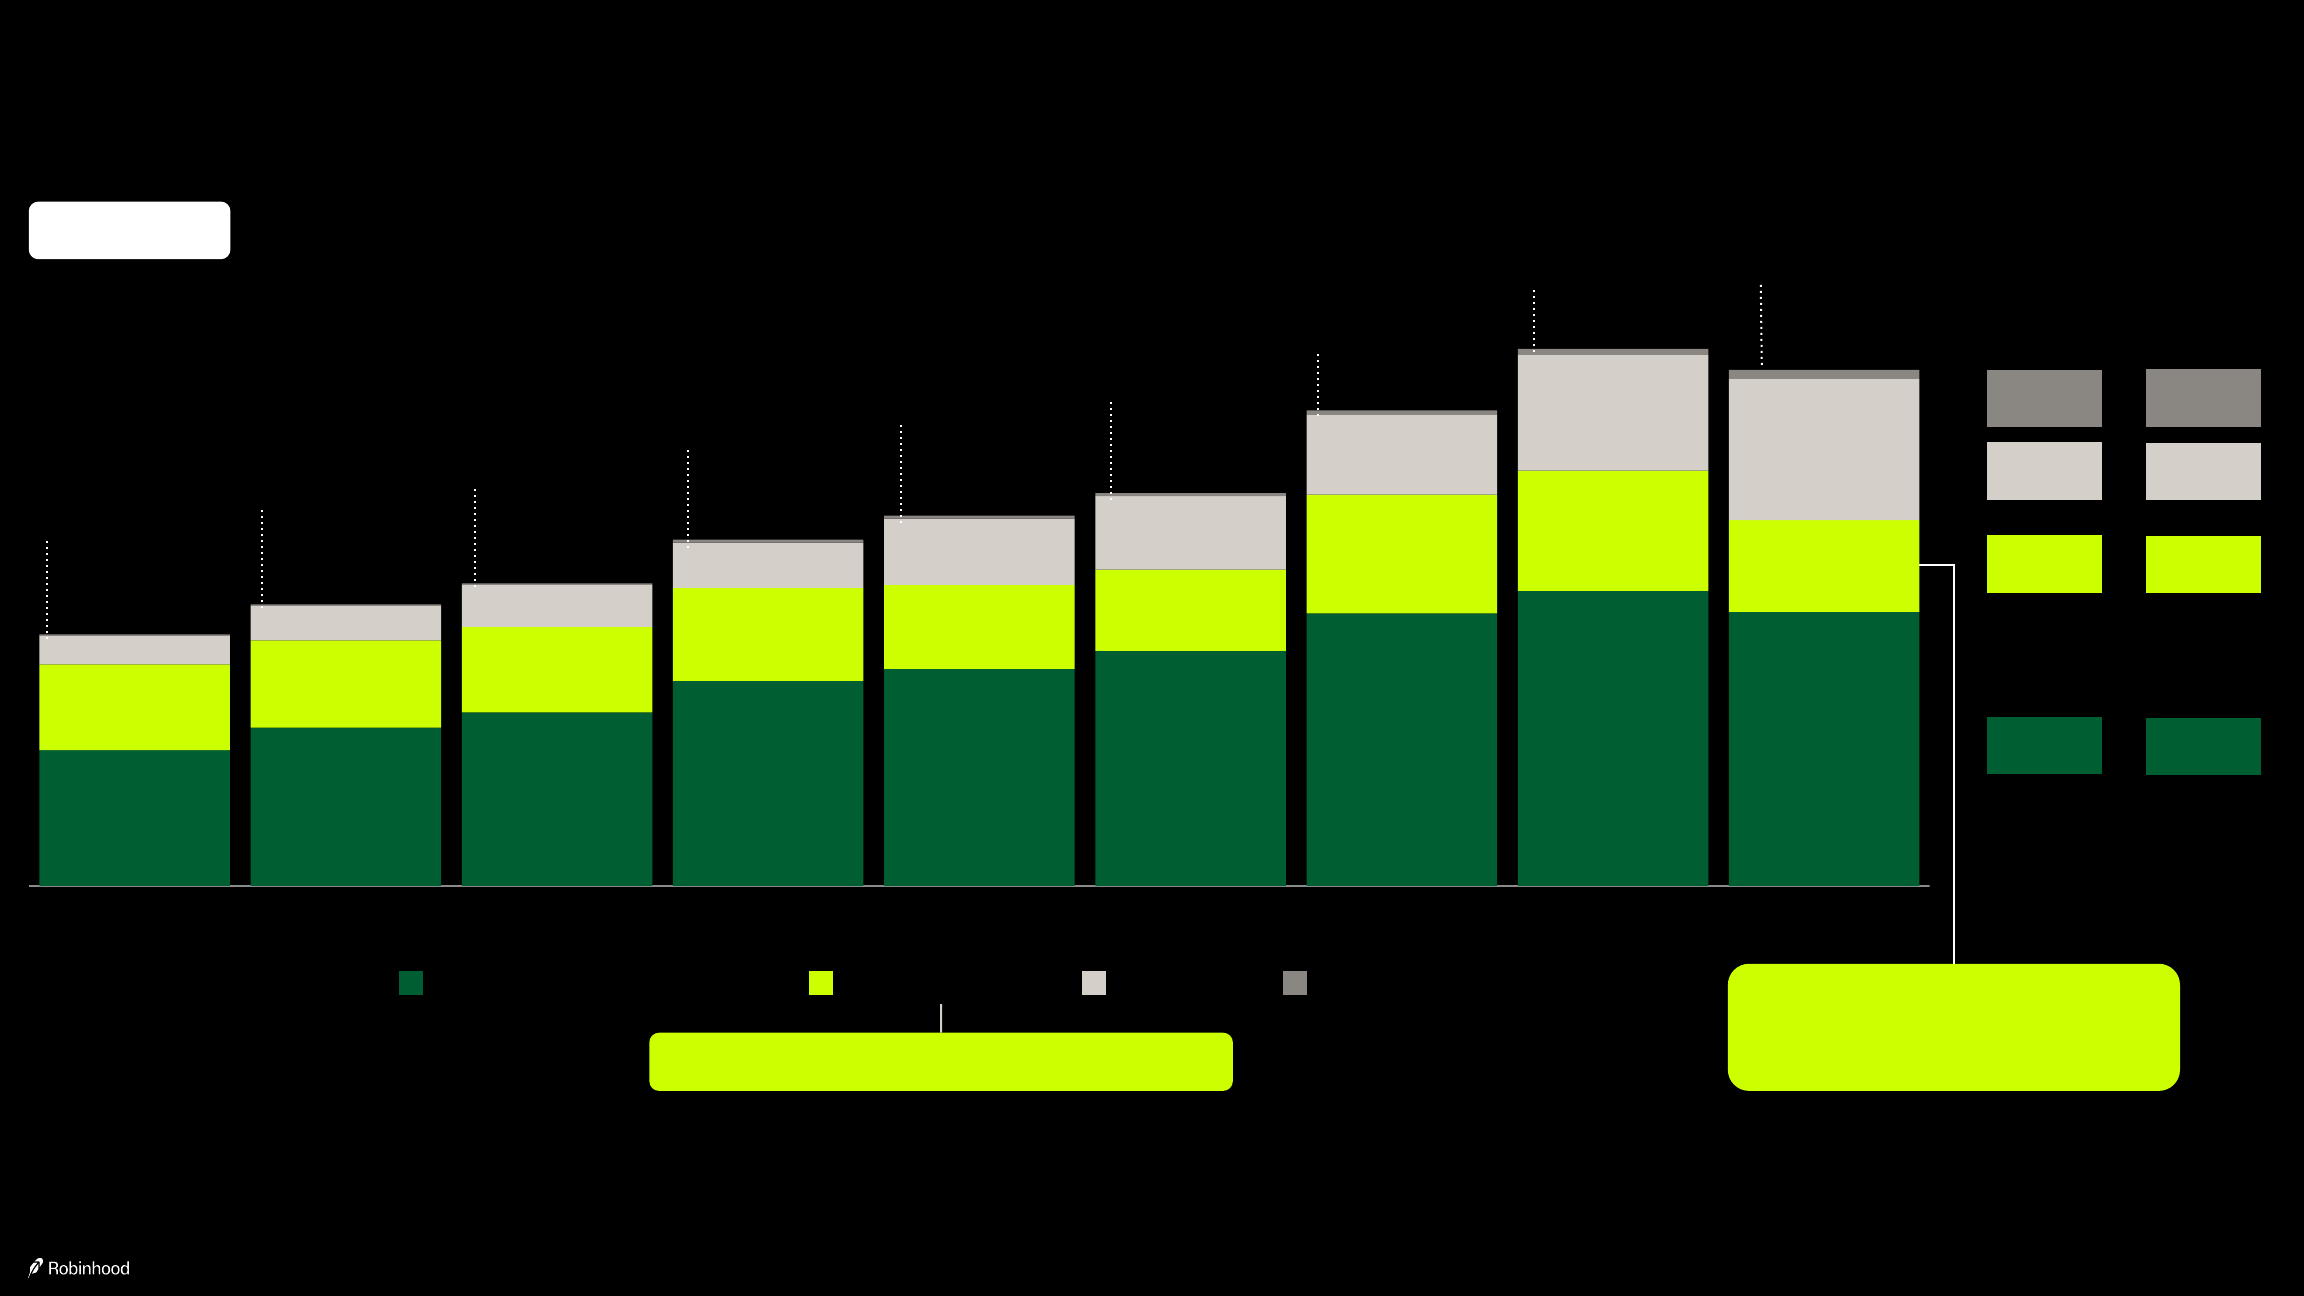
We are building a track record of profitable growth
Total Platform Assets (in billions) | +68% year-over-year
| 2017 | 2018 | 2019 | 2020 | 2021 | 2022 | 2023 | 2024 | 2025 |
|---|---|---|---|---|---|---|---|---|
| $5 | $8 | $14 | $63 | $98 | $62 | $103 | $193 | $324 |
Total Net Revenues (in millions) | +52% year-over-year
| 2017 | 2018 | 2019 | 2020 | 2021 | 2022 | 2023 | 2024 | 2025 |
|---|---|---|---|---|---|---|---|---|
| $49 | $168 | $278 | $958 | $1,815 | $1,358 | $1,865 | $2,951 | $4,473 |
Adjusted Operating Expenses (in millions) | +20% year-over-year
| 2017 | 2018 | 2019 | 2020 | 2021 | 2022 | 2023 | 2024 | 2025 |
|---|---|---|---|---|---|---|---|---|
| $56 | $176 | $357 | $819 | $1,829 | $1,533 | $1,426 | $1,633 | $1,960 |
Adjusted EBITDA (in millions) | +76% year-over-year
| 2017 | 2018 | 2019 | 2020 | 2021 | 2022 | 2023 | 2024 | 2025 |
|---|---|---|---|---|---|---|---|---|
| ($4) | $1 | ($74) | $154 | $33 | ($94) | $536 | $1,429 | $2,522 |
Adjusted Operating Expenses and Adjusted EBITDA are non-GAAP financial measures. Refer to the Appendix for the reconciliations of Adjusted Operating Expenses and Adjusted EBITDA to the most directly comparable GAAP measures, operating expenses and net income (loss), respectively.
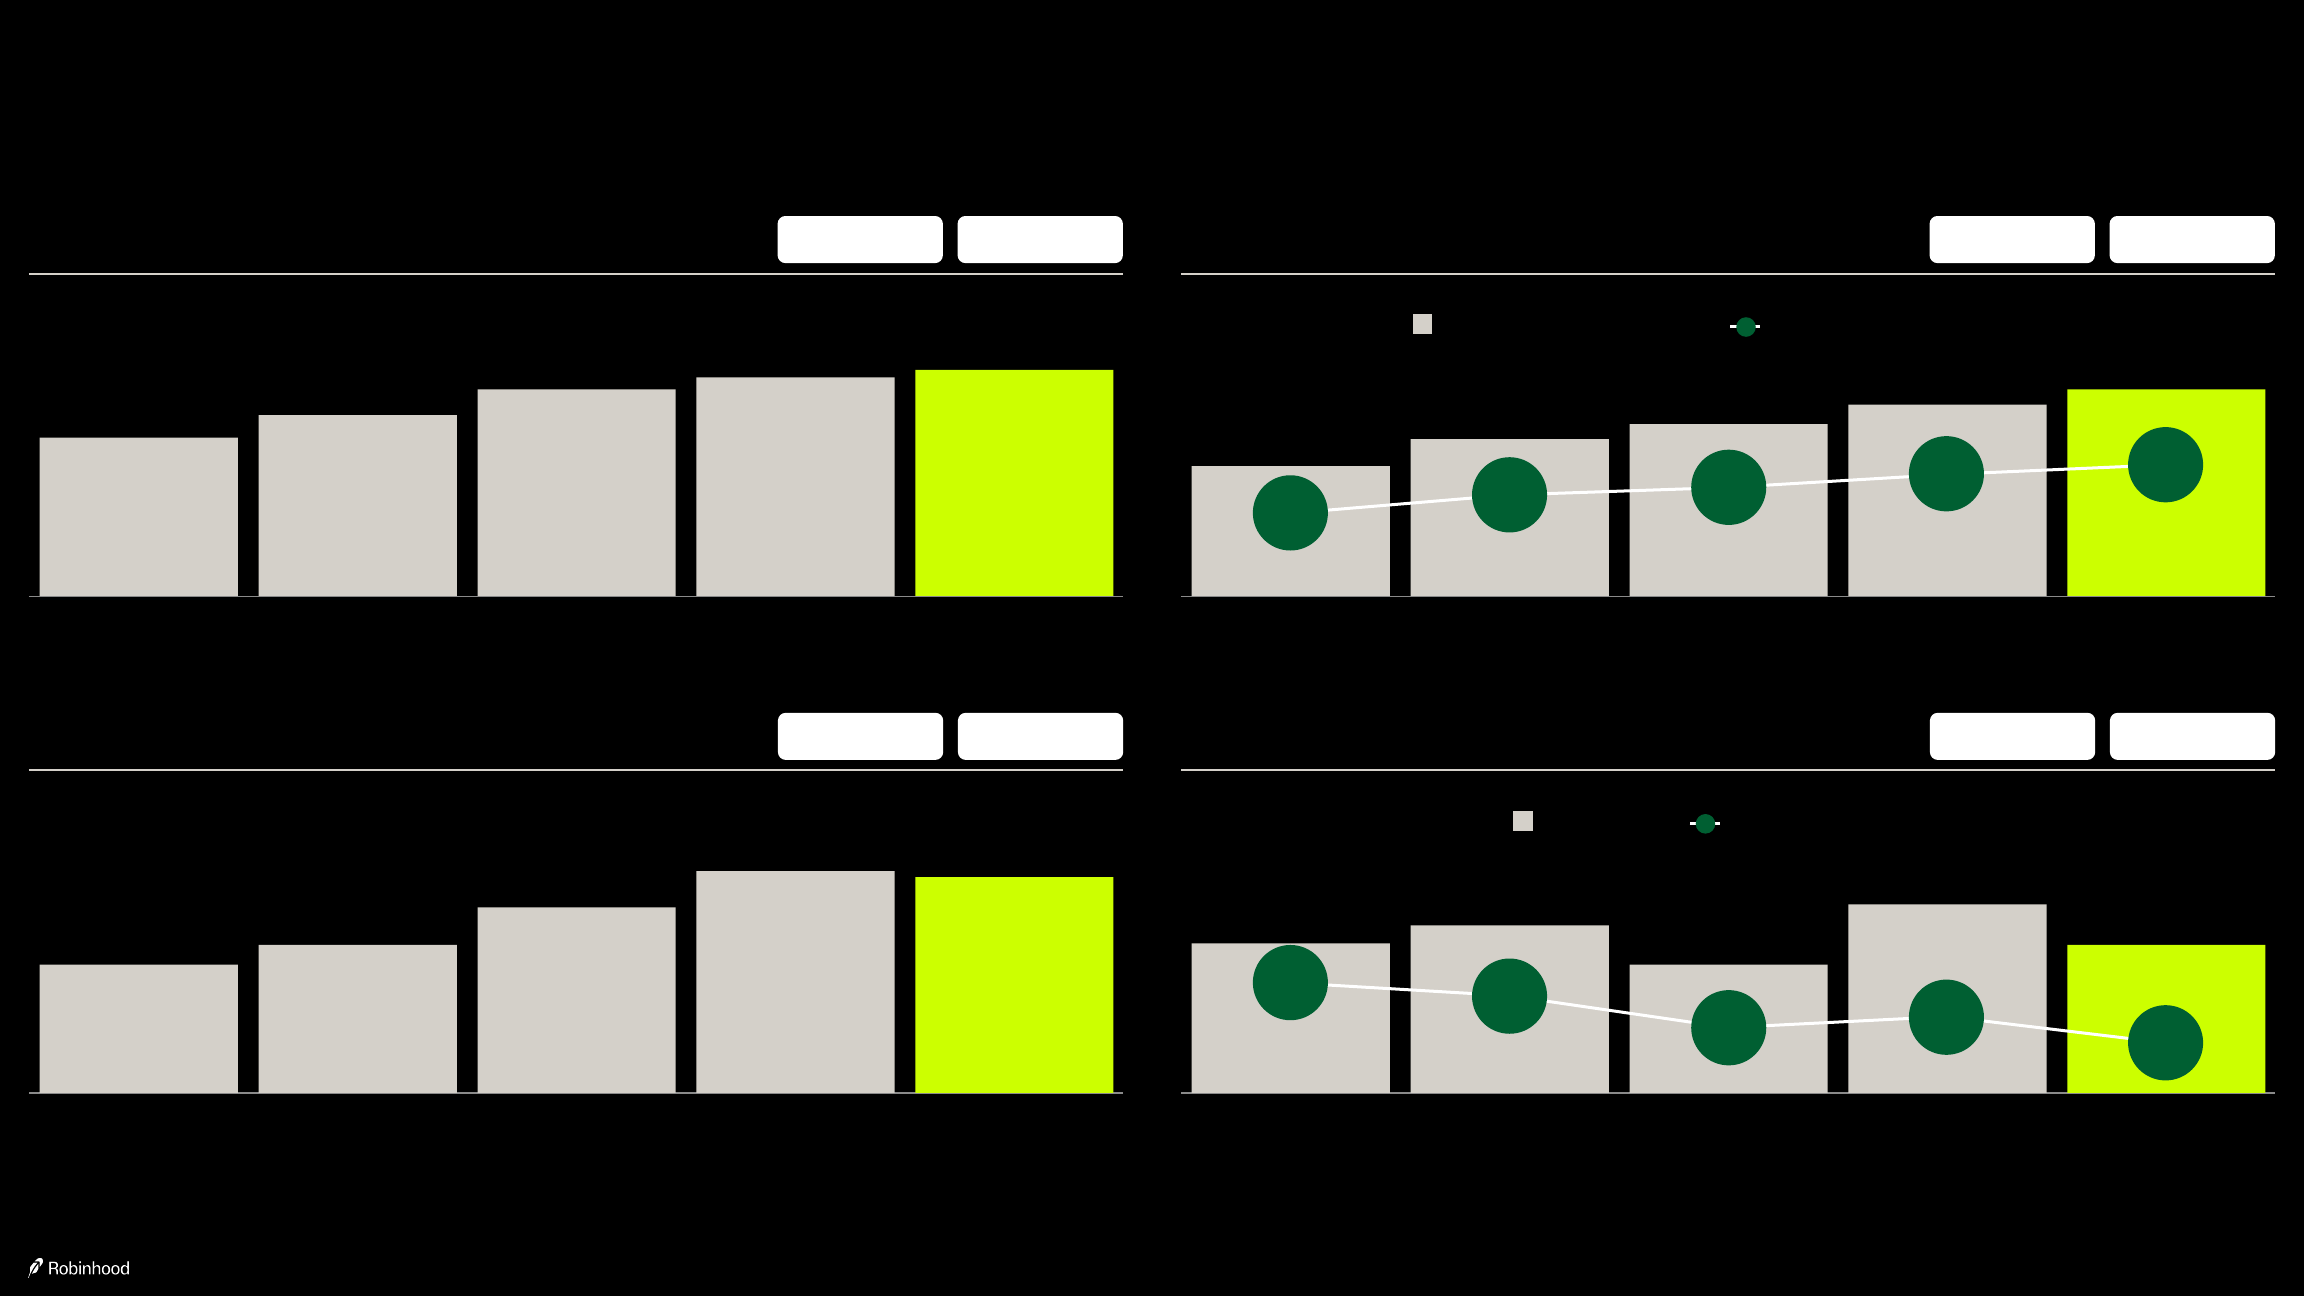
Q4 2025 Business Results Highlights
k = Thousands, B = Billions, M = Millions, LTM = Last twelve months. (1) Defined as end of period Robinhood Gold Subscribers divided by end of period Funded Customers. (2) Starting in June 2025, Net Deposits include results from Bitstamp, which we acquired on 6/2/2025. Net Deposits do not include results from TradePMR. (3) Relative to prior period Total Platform Assets. Refer to definitions in the Appendix for growth rate calculations.
Funded Customers (in millions) | +1.8M year-over-year | +190k sequential
| Q4'24 | Q1'25 | Q2'25 | Q3'25 | Q4'25 |
|---|---|---|---|---|
| 25.2 | 25.8 | 26.5 | 26.8 | 27.0 |
Robinhood Gold Subscribers (in millions) | +1.5M year-over-year | +300k sequential
| Q4'24 | Q1'25 | Q2'25 | Q3'25 | Q4'25 |
|---|---|---|---|---|
| 2.64 | 3.19 | 3.48 | 3.88 | 4.18 |
Robinhood Gold Adoption Rate¹:
| Q4'24 | Q1'25 | Q2'25 | Q3'25 | Q4'25 |
|---|---|---|---|---|
| 10.5% | 12.4% | 13.1% | 14.5% | 15.5% |
Total Platform Assets (in billions) | +68% year-over-year | (3%) sequential
| Q4'24 | Q1'25 | Q2'25 | Q3'25 | Q4'25 |
|---|---|---|---|---|
| $193 | $221 | $279 | $333 | $324 |
Net Deposits² (in billions) | $68B LTM | +35% LTM Growth
| Q4'24 | Q1'25 | Q2'25 | Q3'25 | Q4'25 |
|---|---|---|---|---|
| $16.1 | $18.0 | $13.8 | $20.4 | $15.9 |
Annualized Growth Rate³:
| Q4'24 | Q1'25 | Q2'25 | Q3'25 | Q4'25 |
|---|---|---|---|---|
| 42% | 37% | 25% | 29% | 19% |
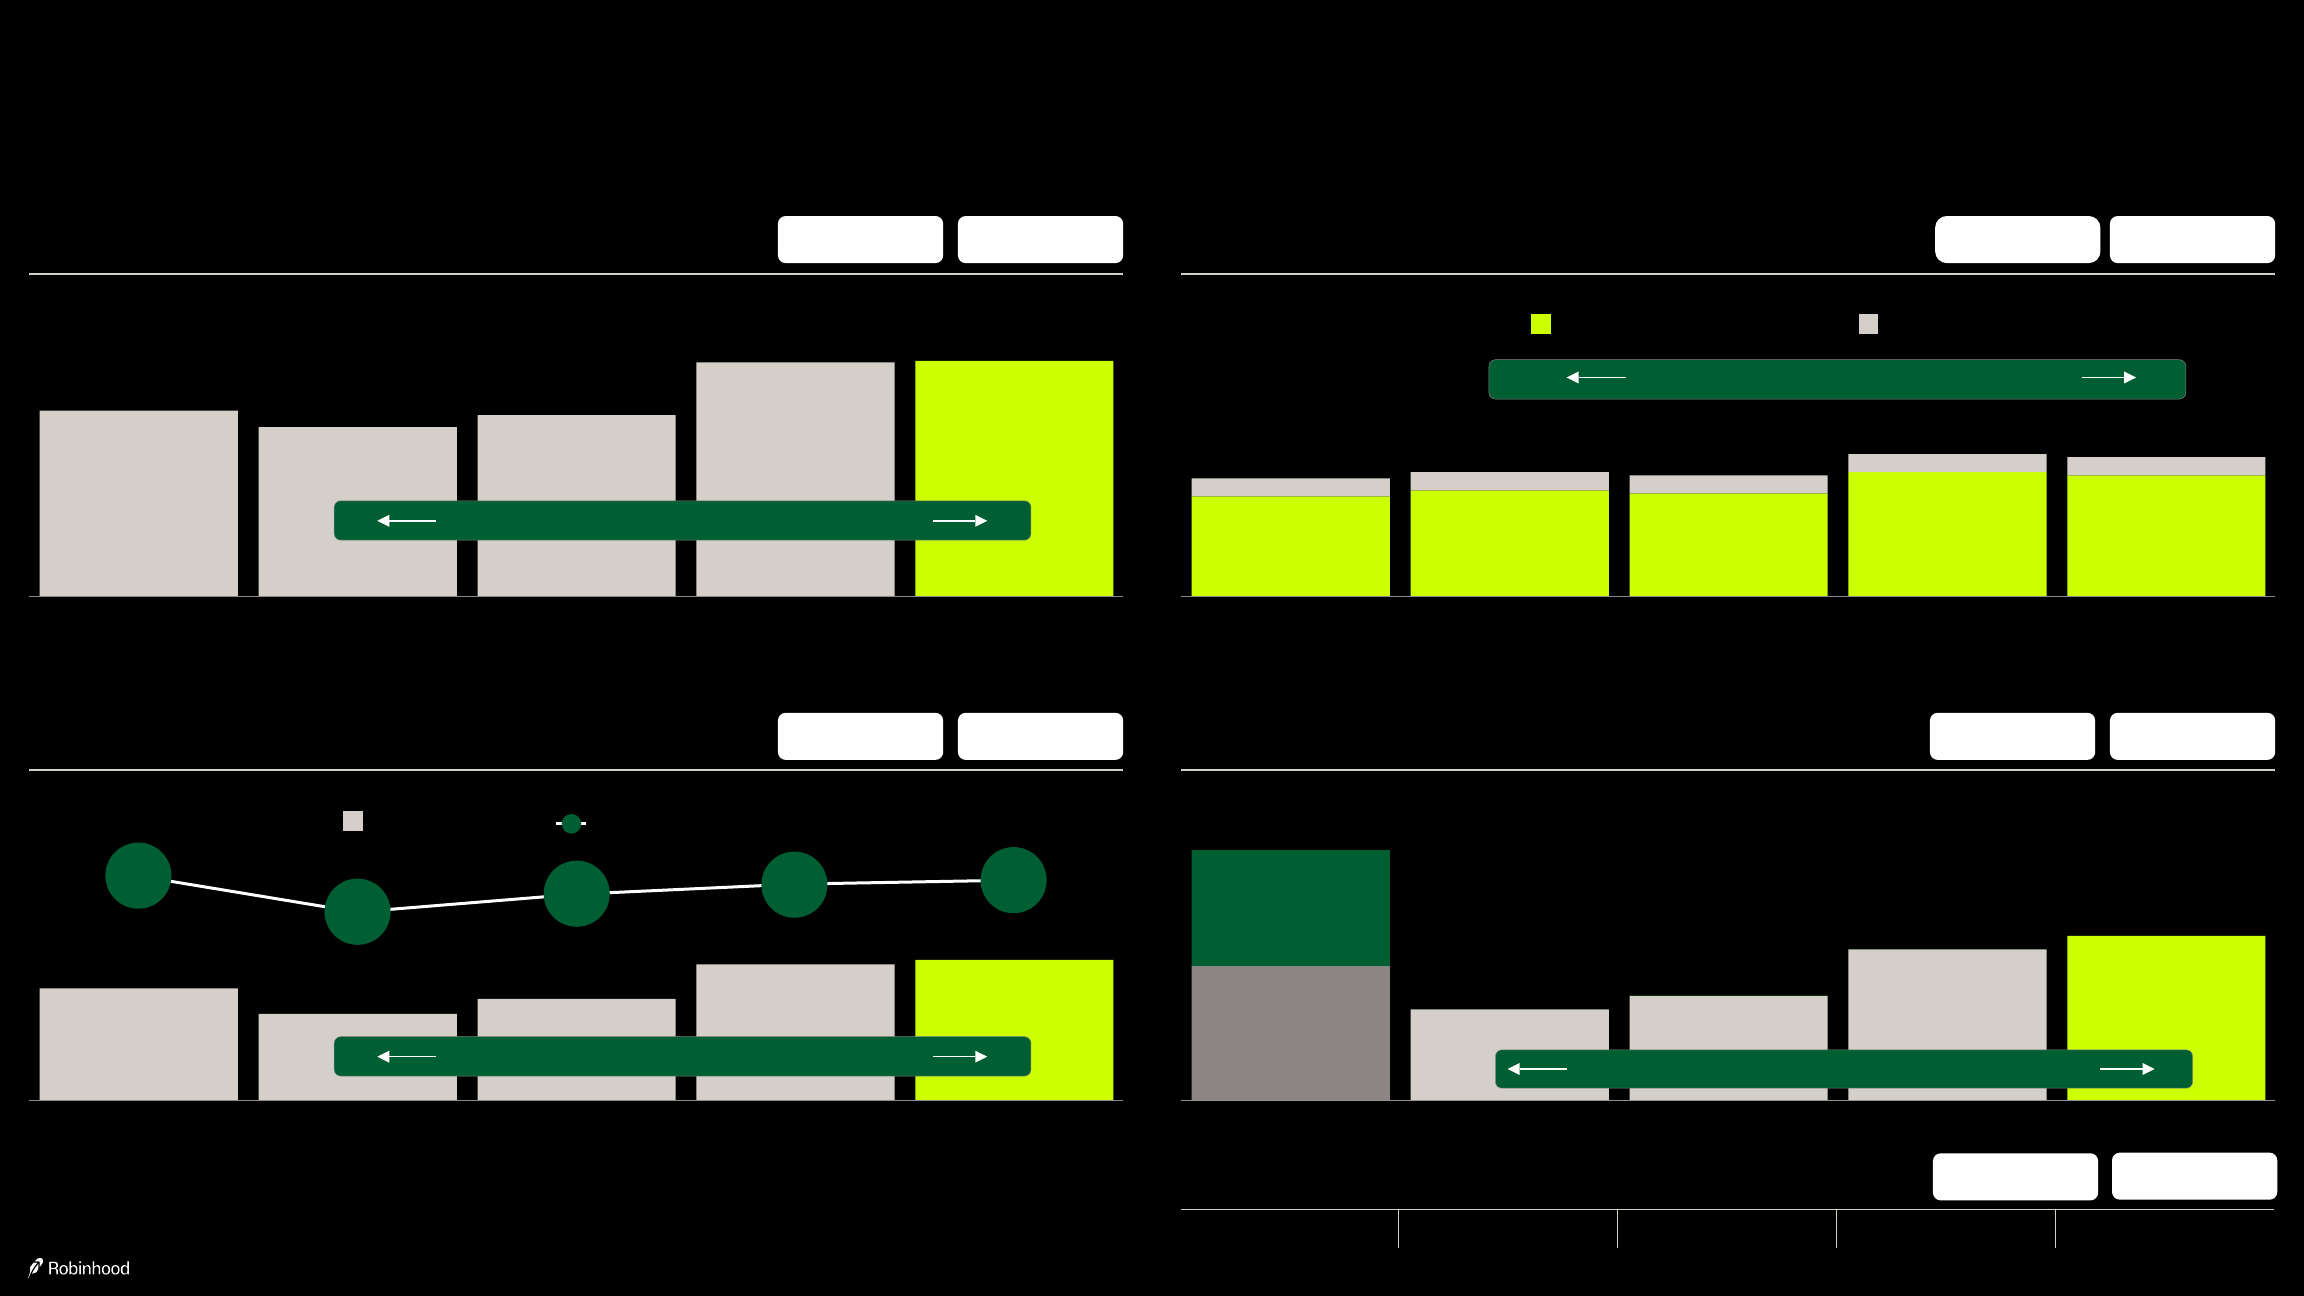
Q4 2025 Financial Results Highlights
(1) Q4 2024 Net Income Prior to Tax Benefit and Regulatory Accrual Reversal was $492M in Q4 2024. Q4 2024 EPS Prior to Tax Benefit and Regulatory Accrual Reversal was $0.54 in Q4 2024.
Adjusted Operating Expenses and SBC, Adjusted EBITDA, Adjusted EBITDA Margin, Q4 2024 Net Income Prior to Tax Benefit and Regulatory Accrual Reversal, and Q4 2024 EPS Prior to Tax Benefit and Regulatory Accrual Reversal are non-GAAP financial measures. Refer to the Appendix for the reconciliations of Adjusted Operating Expenses and SBC, Adjusted EBITDA, Adjusted EBITDA Margin, Q4 2024 Net Income Prior to Tax Benefit and Regulatory Accrual Reversal, and Q4 2024 EPS Prior to Tax Benefit and Regulatory Accrual Reversal to the most directly comparable GAAP measures, operating expenses, net income, net margin, net income, and diluted EPS, respectively.
Total Net Revenues (in millions) | +27% year-over-year | +1% sequential
| Q4'24 | Q1'25 | Q2'25 | Q3'25 | Q4'25 |
|---|---|---|---|---|
| $1,014 | $927 | $989 | $1,274 | $1,283 |
$4.5B in 2025
Adjusted Operating Expenses and SBC (in millions) | +18% year-over-year | (3%) sequential
| Q4'24 | Q1'25 | Q2'25 | Q3'25 | Q4'25 | |
|---|---|---|---|---|---|
| Adjusted Operating Expenses | $431 | $460 | $444 | $535 | $521 |
| SBC | $77 | $73 | $78 | $78 | $76 |
| Total | $508 | $533 | $522 | $613 | $597 |
$2.27B in 2025
Adjusted EBITDA (in millions) | +24% year-over-year | +3% sequential
| Q4'24 | Q1'25 | Q2'25 | Q3'25 | Q4'25 |
|---|---|---|---|---|
| $613 | $470 | $549 | $742 | $761 |
Adjusted EBITDA Margin:
| Q4'24 | Q1'25 | Q2'25 | Q3'25 | Q4'25 |
|---|---|---|---|---|
| 60% | 51% | 56% | 58% | 59% |
$2.5B (56% margin) in 2025
Net Income¹ (in millions) | ($311) year-over-year | +$49 sequential
| Q4'24 | Q1'25 | Q2'25 | Q3'25 | Q4'25 |
|---|---|---|---|---|
| $916 | $336 | $386 | $556 | $605 |
Q4 2024 includes Tax Benefit and Regulatory Accrual Reversal of $424M; Q4 2024 Net Income Prior to Tax Benefit and Regulatory Accrual Reversal was $492M
Diluted Earnings per Share (EPS)¹
| Q4'24 | Q1'25 | Q2'25 | Q3'25 | Q4'25 |
|---|---|---|---|---|
| $1.01 | $0.37 | $0.42 | $0.61 | $0.66 |
($0.35) year-over-year | +$0.05 sequential
$1.9B ($2.05 of diluted EPS) in 2025
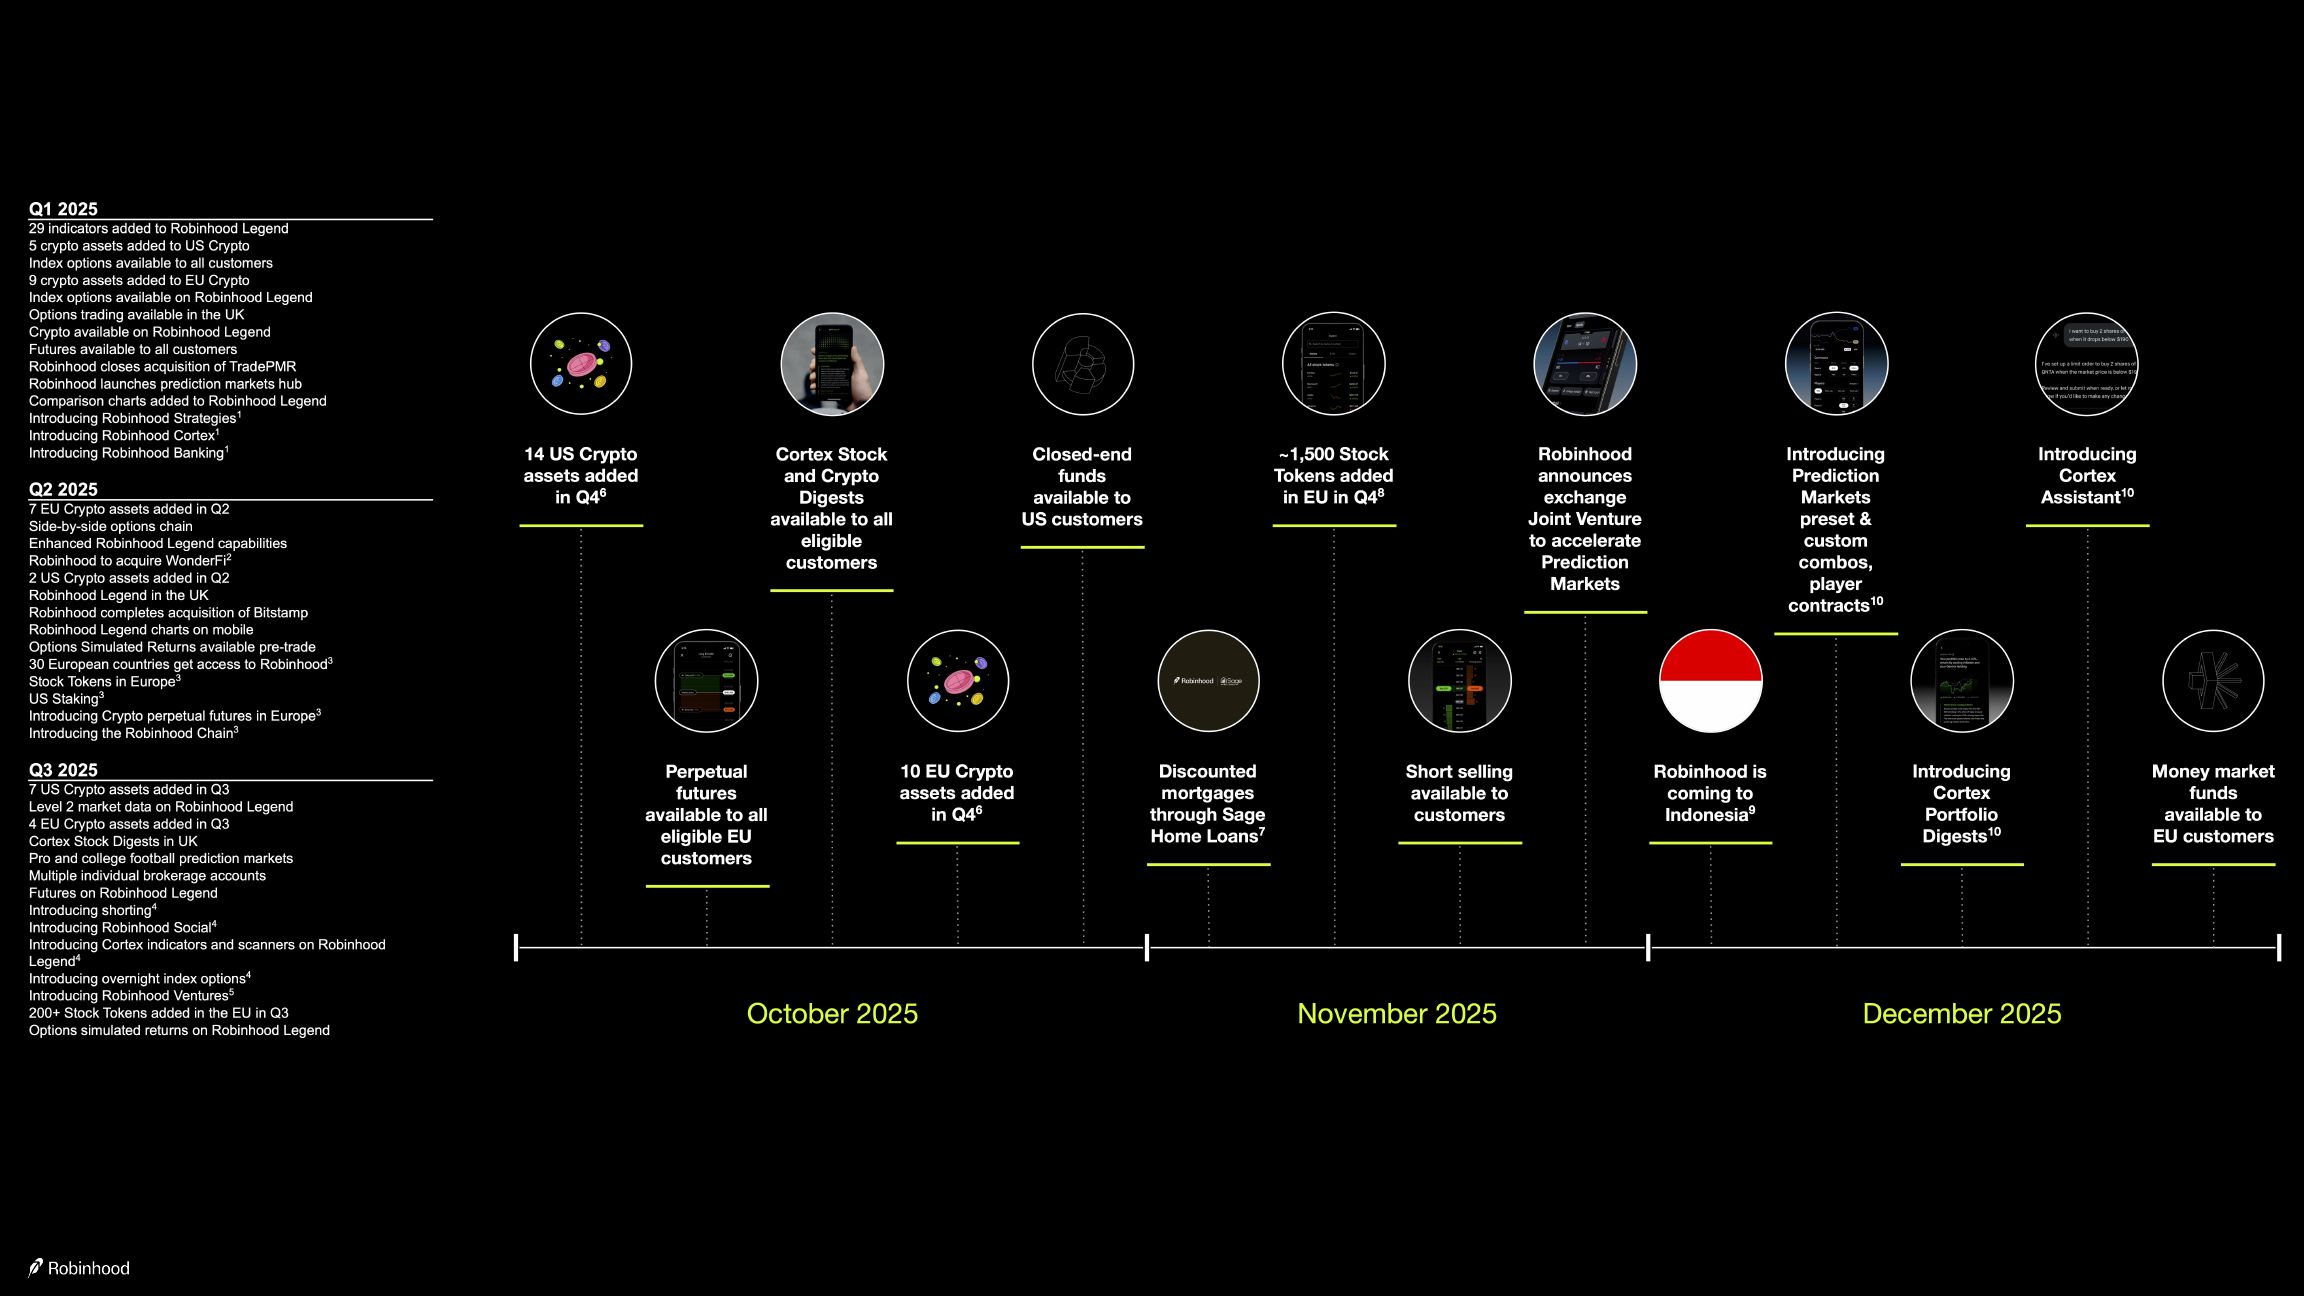
Our product velocity increased significantly in 2025
Q1 2025
- 29 indicators added to Robinhood Legend
- 5 crypto assets added to US Crypto
- Index options available to all customers
- 9 crypto assets added to EU Crypto
- Index options available on Robinhood Legend
- Options trading available in the UK
- Crypto available on Robinhood Legend
- Futures available to all customers
- Robinhood closes acquisition of TradePMR
- Robinhood launches prediction markets hub
- Comparison charts added to Robinhood Legend
- Introducing Robinhood Strategies¹
- Introducing Robinhood Cortex¹
- Introducing Robinhood Banking¹
Q2 2025
- 7 EU Crypto assets added in Q2
- Side-by-side options chain
- Enhanced Robinhood Legend capabilities
- Robinhood to acquire WonderFi²
- 2 US Crypto assets added in Q2
- Robinhood Legend in the UK
- Robinhood completes acquisition of Bitstamp
- Robinhood Legend charts on mobile
- Options Simulated Returns available pre-trade
- 30 European countries get access to Robinhood³
- Stock Tokens in Europe³
- US Staking³
- Introducing Crypto perpetual futures in Europe³
- Introducing the Robinhood Chain³
Q3 2025
- 7 US Crypto assets added in Q3
- Level 2 market data on Robinhood Legend
- 4 EU Crypto assets added in Q3
- Cortex Stock Digests in UK
- Pro and college football prediction markets
- Multiple individual brokerage accounts
- Futures on Robinhood Legend
- Introducing shorting⁴
- Introducing Robinhood Social⁴
- Introducing Robinhood Cortex indicators and scanners on Robinhood Legend⁴
- Introducing overnight index options⁴
- Introducing Robinhood Ventures⁵
- 200+ Stock Tokens added to the EU in Q3
- Options simulated returns on Robinhood Legend
October 2025
- 14 US Crypto assets added in Q4⁶
- Perpetual futures available to all eligible EU customers
- Cortex Stock and Crypto Digests available to all eligible customers
- 10 EU Crypto assets added in Q4⁶
November 2025
- Closed-end funds available to US customers
- Discounted mortgages through Sage Home Loans⁷
- ~1,500 Stock Tokens added in EU in Q4⁸
- Short selling available to customers
- Robinhood announces exchange Joint Venture to accelerate Prediction Markets
- Robinhood is coming to Indonesia⁹
December 2025
- Introducing Prediction Markets preset & custom combos, player contracts¹⁰
- Introducing Cortex Portfolio Digests¹⁰
- Introducing Cortex Assistant¹⁰
- Money market funds available to EU customers
(1) Announced Robinhood Strategies (available to all US customers), Robinhood Cortex Digests (available to all eligible customers), Robinhood Cortex Trade Builder (not yet available to Gold Subscribers), and Robinhood Banking (currently rolling out to Gold Subscribers) on March 27, 2025. Robinhood is a financial technology company, not a bank. Banking services are provided by Coastal Community Bank, Member FDIC. (2) Announced Robinhood entered into an agreement to acquire WonderFi on 5/13/2025. The pending acquisition is subject to customary closing conditions, including regulatory approvals. (3) Announced Robinhood availability across 30 EU and EEA countries (up from 4 prior), Stock Tokens in Europe (available to all eligible European customers), US staking for ETH and SOL (available to all eligible US customers), crypto perpetual futures in Europe (available to all eligible EU customers), and the Robinhood Chain (under development) on 6/30/2025. (4) Announced shorting (currently rolling out to customers), Robinhood Social (rolling out early 2026), Robinhood Cortex indicators and scanners on Robinhood Legend (rolling out early 2026 to Gold Subscribers), and overnight index options (rolling out early 2026) on 9/10/2025. (5) Robinhood Ventures is a broader initiative that Robinhood is planning to launch to give retail investors exposure to private companies. (6) Increased US Crypto assets by 14 to a total of 49 and EU Crypto assets by 10 to a total of 69 in Q4. (7) Available to eligible Gold Subscribers. Sage Home Loans Corporation NMLS ID #3304 is not affiliated with any Robinhood entity. Robinhood is not a lender. (8) Increased Stock Tokens available to EU Customers by over 1,500 in Q4 to a total of approximately 2,000. (9) Announced Robinhood entered into agreements to acquire PT Buana Capital Sekuritas, an Indonesian brokerage, and PT Pedagang Aset Kripto, a licensed Indonesian digital financial asset trader on 12/7/2025. Each pending acquisition is subject to customary closing conditions, including regulatory approvals. (10) Announced Prediction Markets preset combos (available to all eligible US customers), custom combos (rolling out early 2026), player contracts (available to all eligible US customers), Cortex Portfolio Digests (currently rolling out to Gold Subscribers), and Cortex Assistant (rolling out early 2026 to Gold Subscribers) on 12/16/2025.

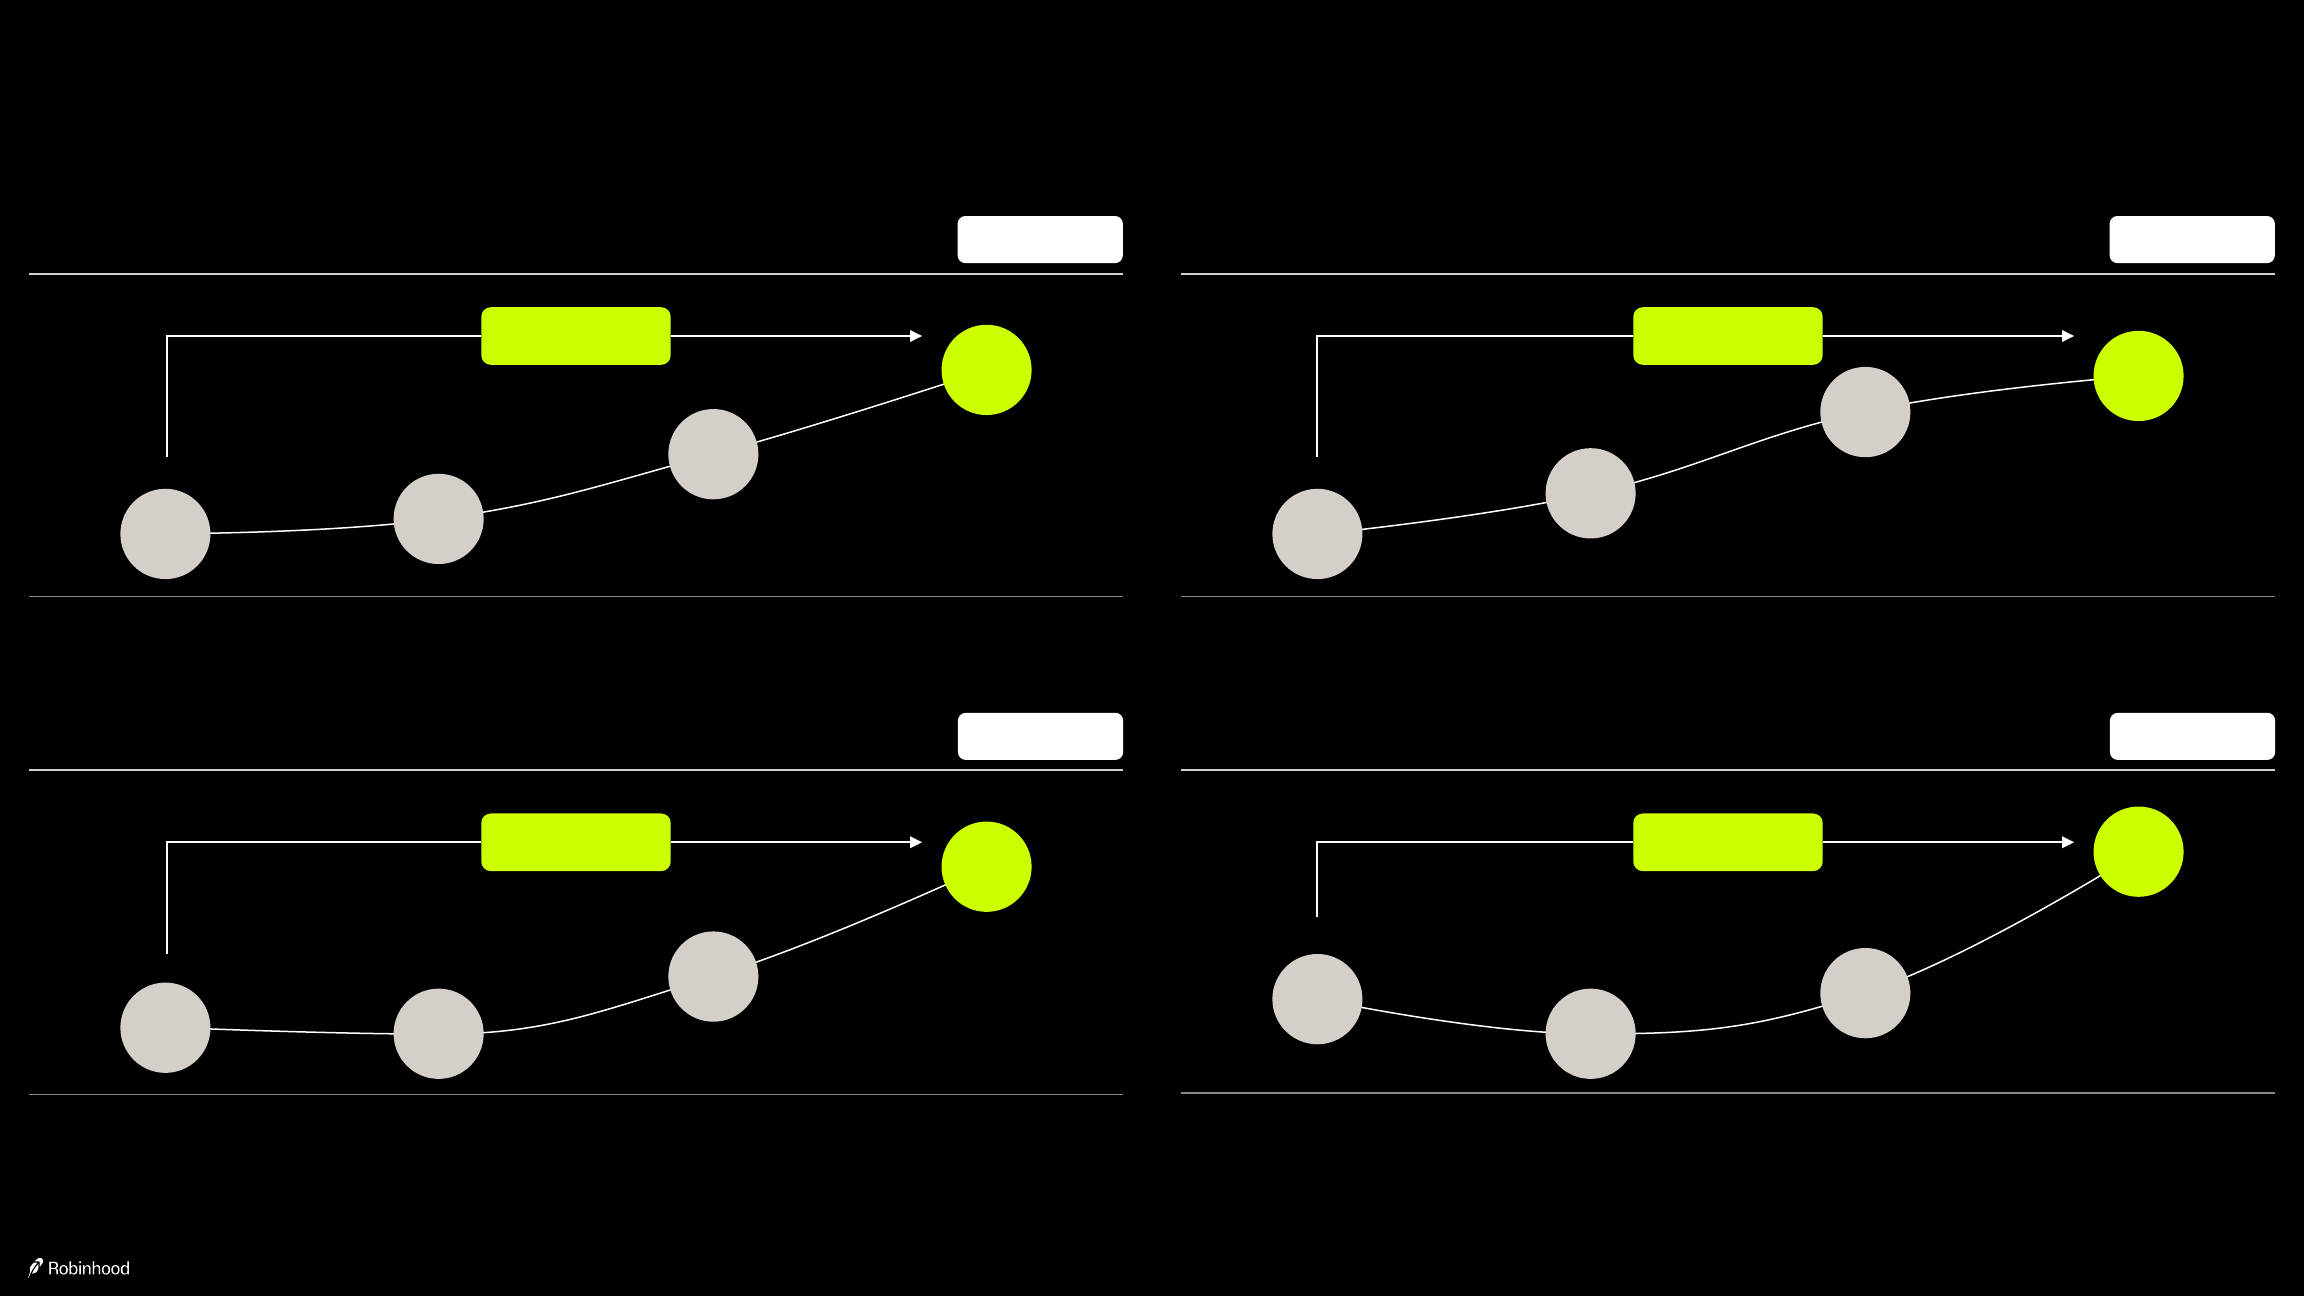
Robinhood 10 Year Vision
#1 in Active Traders →
#1 in Wallet Share for the Next Generation →
#1 Global Financial Ecosystem →
| Today | Peak ~1-2 years | Peak ~5 years | Peak ~10 years |
|---|

#1 in Active Traders
| 2025 Priorities | 2026+ Priorities |
|---|---|
| 1 Social Trading | 1 Prediction Markets |
| 2 Index Options, Futures, Event Contracts | 2 SuperApp design |
| 3 Robinhood Legend | 3 Cortex, Social |
#1 in Wallet Share for the Next Generation
| 2025 Priorities | 2026+ Priorities |
|---|---|
| 1 Advisory, Banking launch | 1 Family Investing |
| 2 Scaling and validating the economics of the Gold Card | 2 Private Markets |
| 3 Matches, personalized deposit and activation incentives |
#1 Global Financial Ecosystem
| 2025 Priorities | 2026+ Priorities |
|---|---|
| 1 Options and futures trading in UK, launch in APAC, acquire licenses for additional markets | 1 Tokenization, Robinhood Chain |
| 2 Multi-Currency Accounts, Stablecoin, Tokenization | 2 Launch in new markets |
| 3 ISAs and SIPPs in UK |
Funded Customers increased by 1.8 million year-over-year to 27.0 million in Q4
In millions
Year-over-year change: +1.8M Sequential change: +190k
| Q4'23 | Q1'24 | Q2'24 | Q3'24 | Q4'24 | Q1'25 | Q2'25 | Q3'25 | Q4'25 |
|---|---|---|---|---|---|---|---|---|
| 23.4 | 23.9 | 24.2 | 24.3 | 25.2 | 25.8 | 26.5 | 26.8 | 27.0 |
Investment Accounts¹:
| Q4'23 | Q1'24 | Q2'24 | Q3'24 | Q4'24 | Q1'25 | Q2'25 | Q3'25 | Q4'25 |
|---|---|---|---|---|---|---|---|---|
| 23.8 | 24.4 | 24.8 | 25.1 | 26.2 | 27.0 | 27.4 | 27.9 | 28.4 |
As of Q4 2025, we had 28.4M Investment Accounts, up 2.2M year-over-year.
(1) Bitstamp Funded Customers are not reflected in the Investment Accounts total as they are not brokerage or other Investment Accounts. Refer to Appendix for definitions of Funded Customers and Investment Accounts.
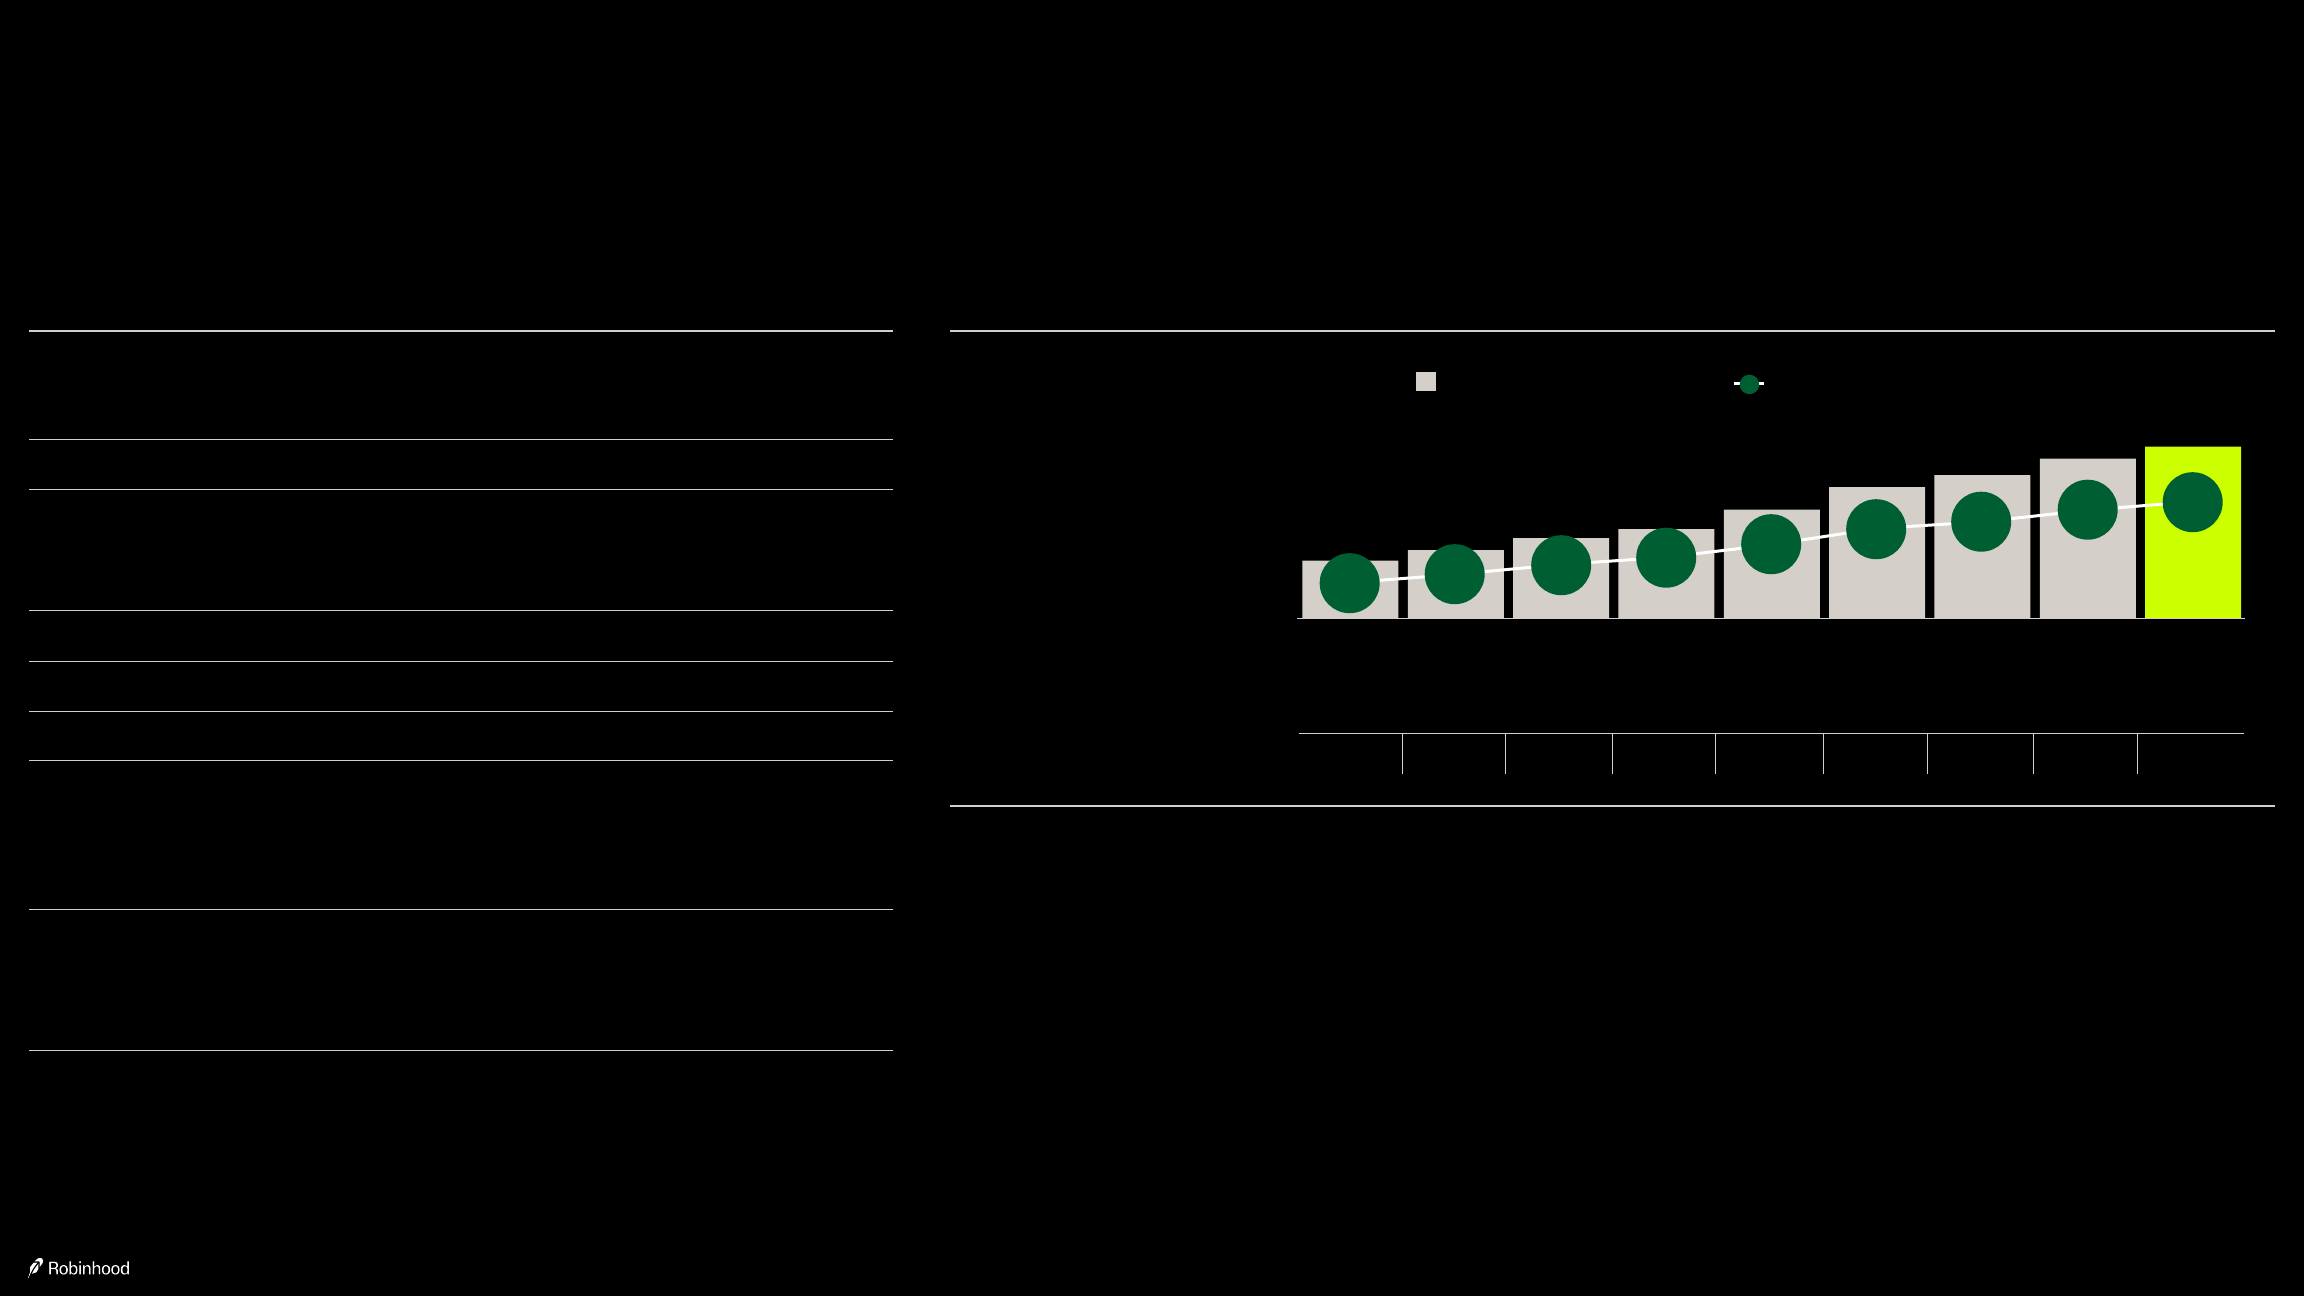
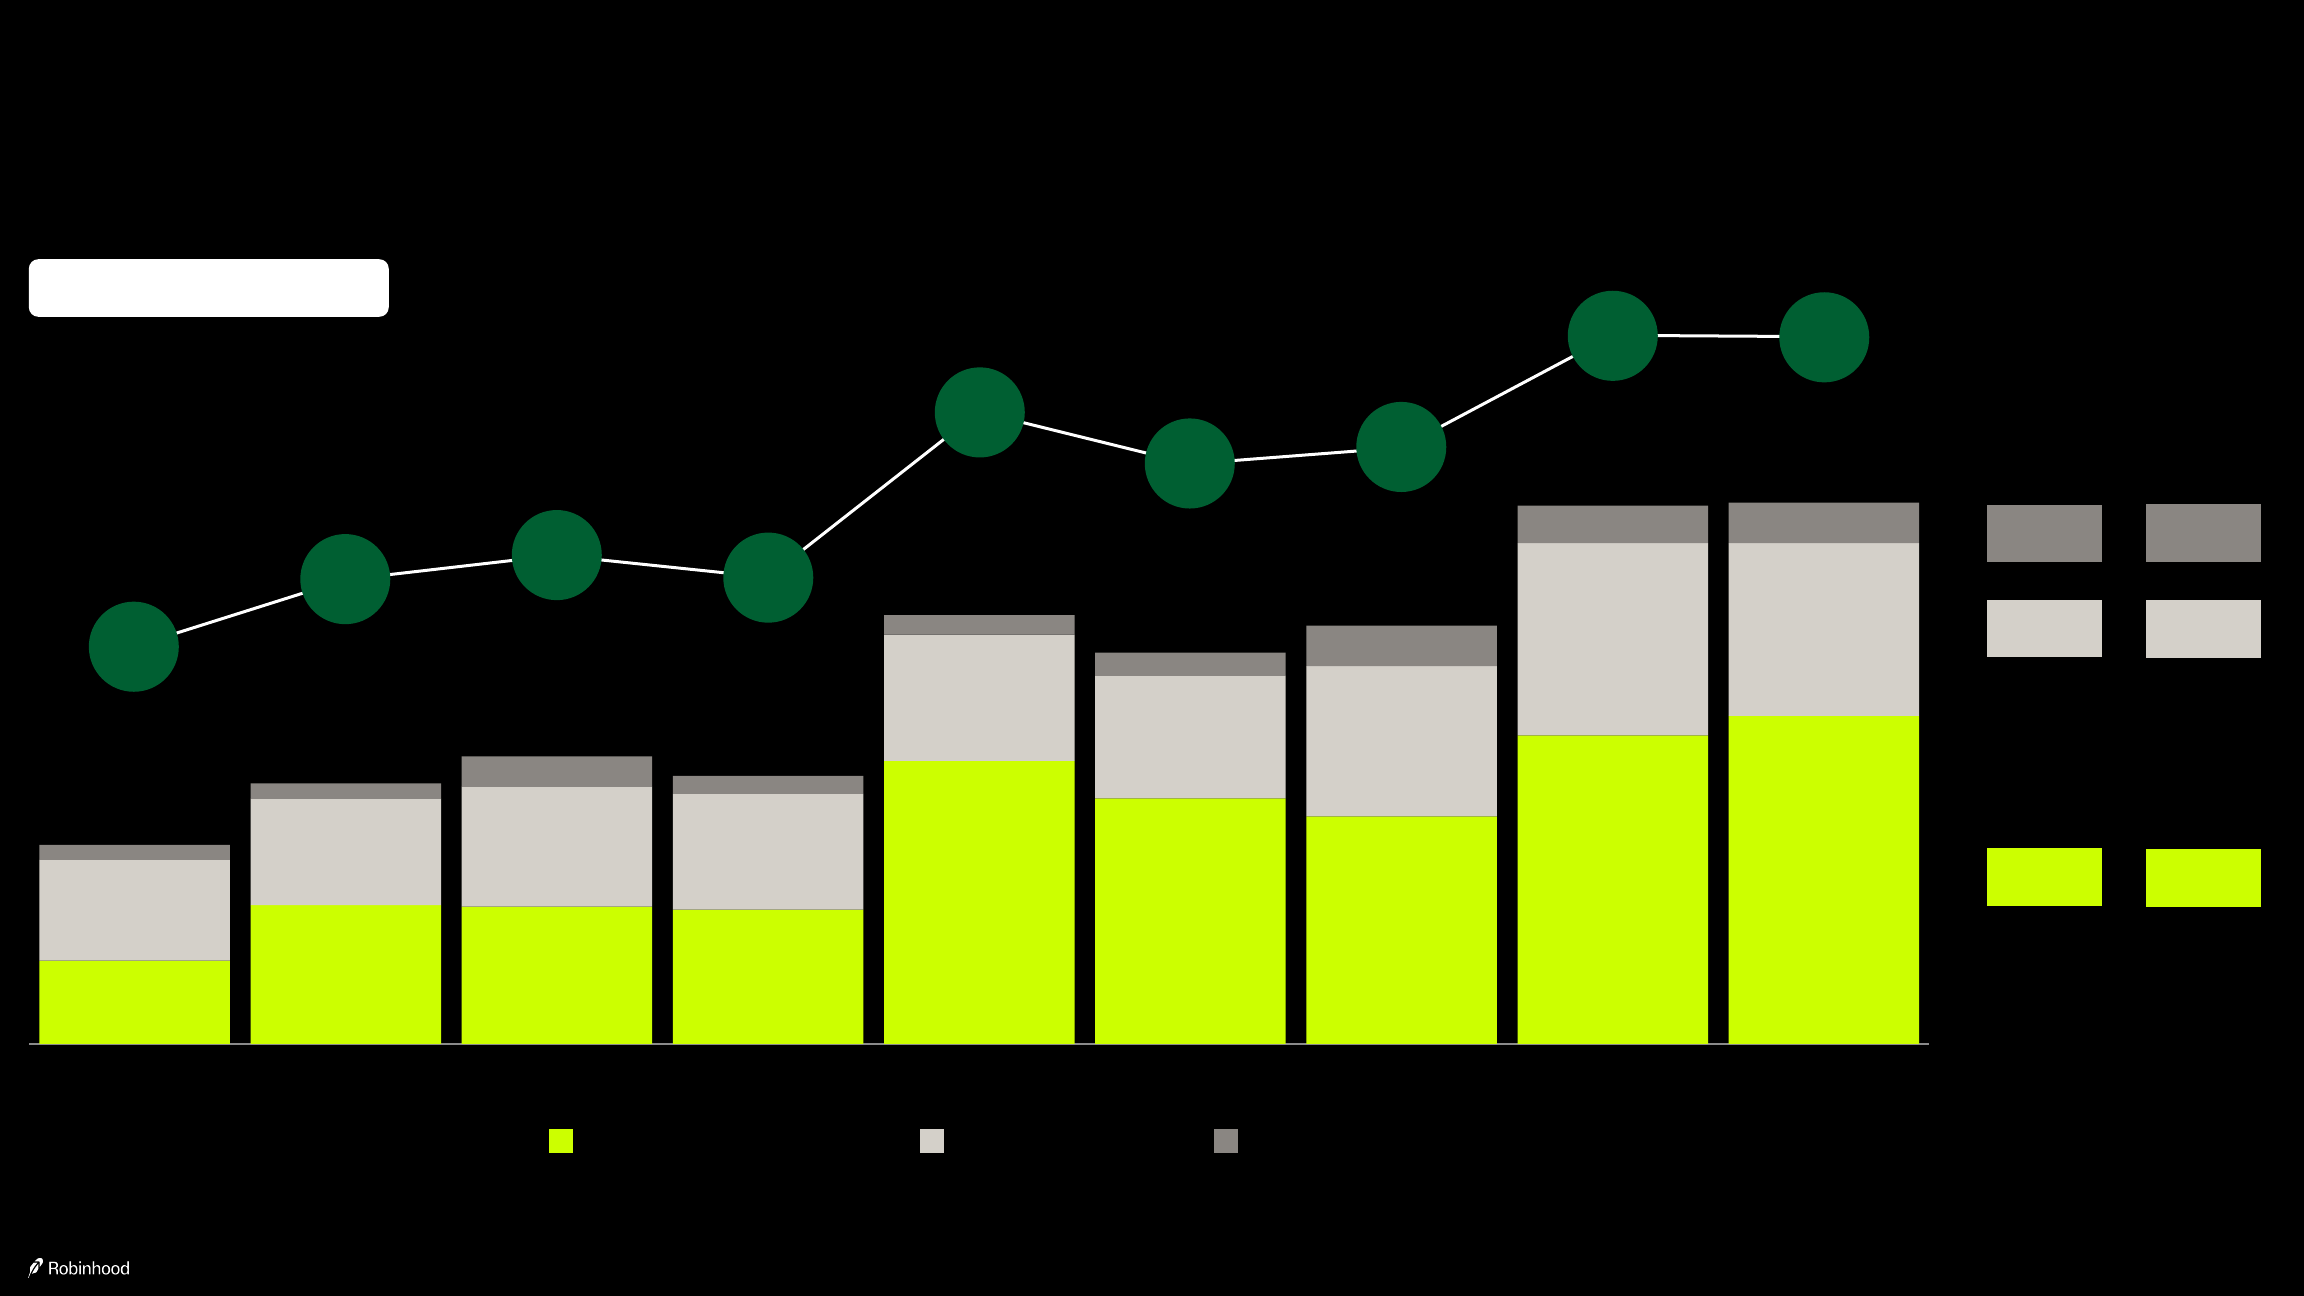
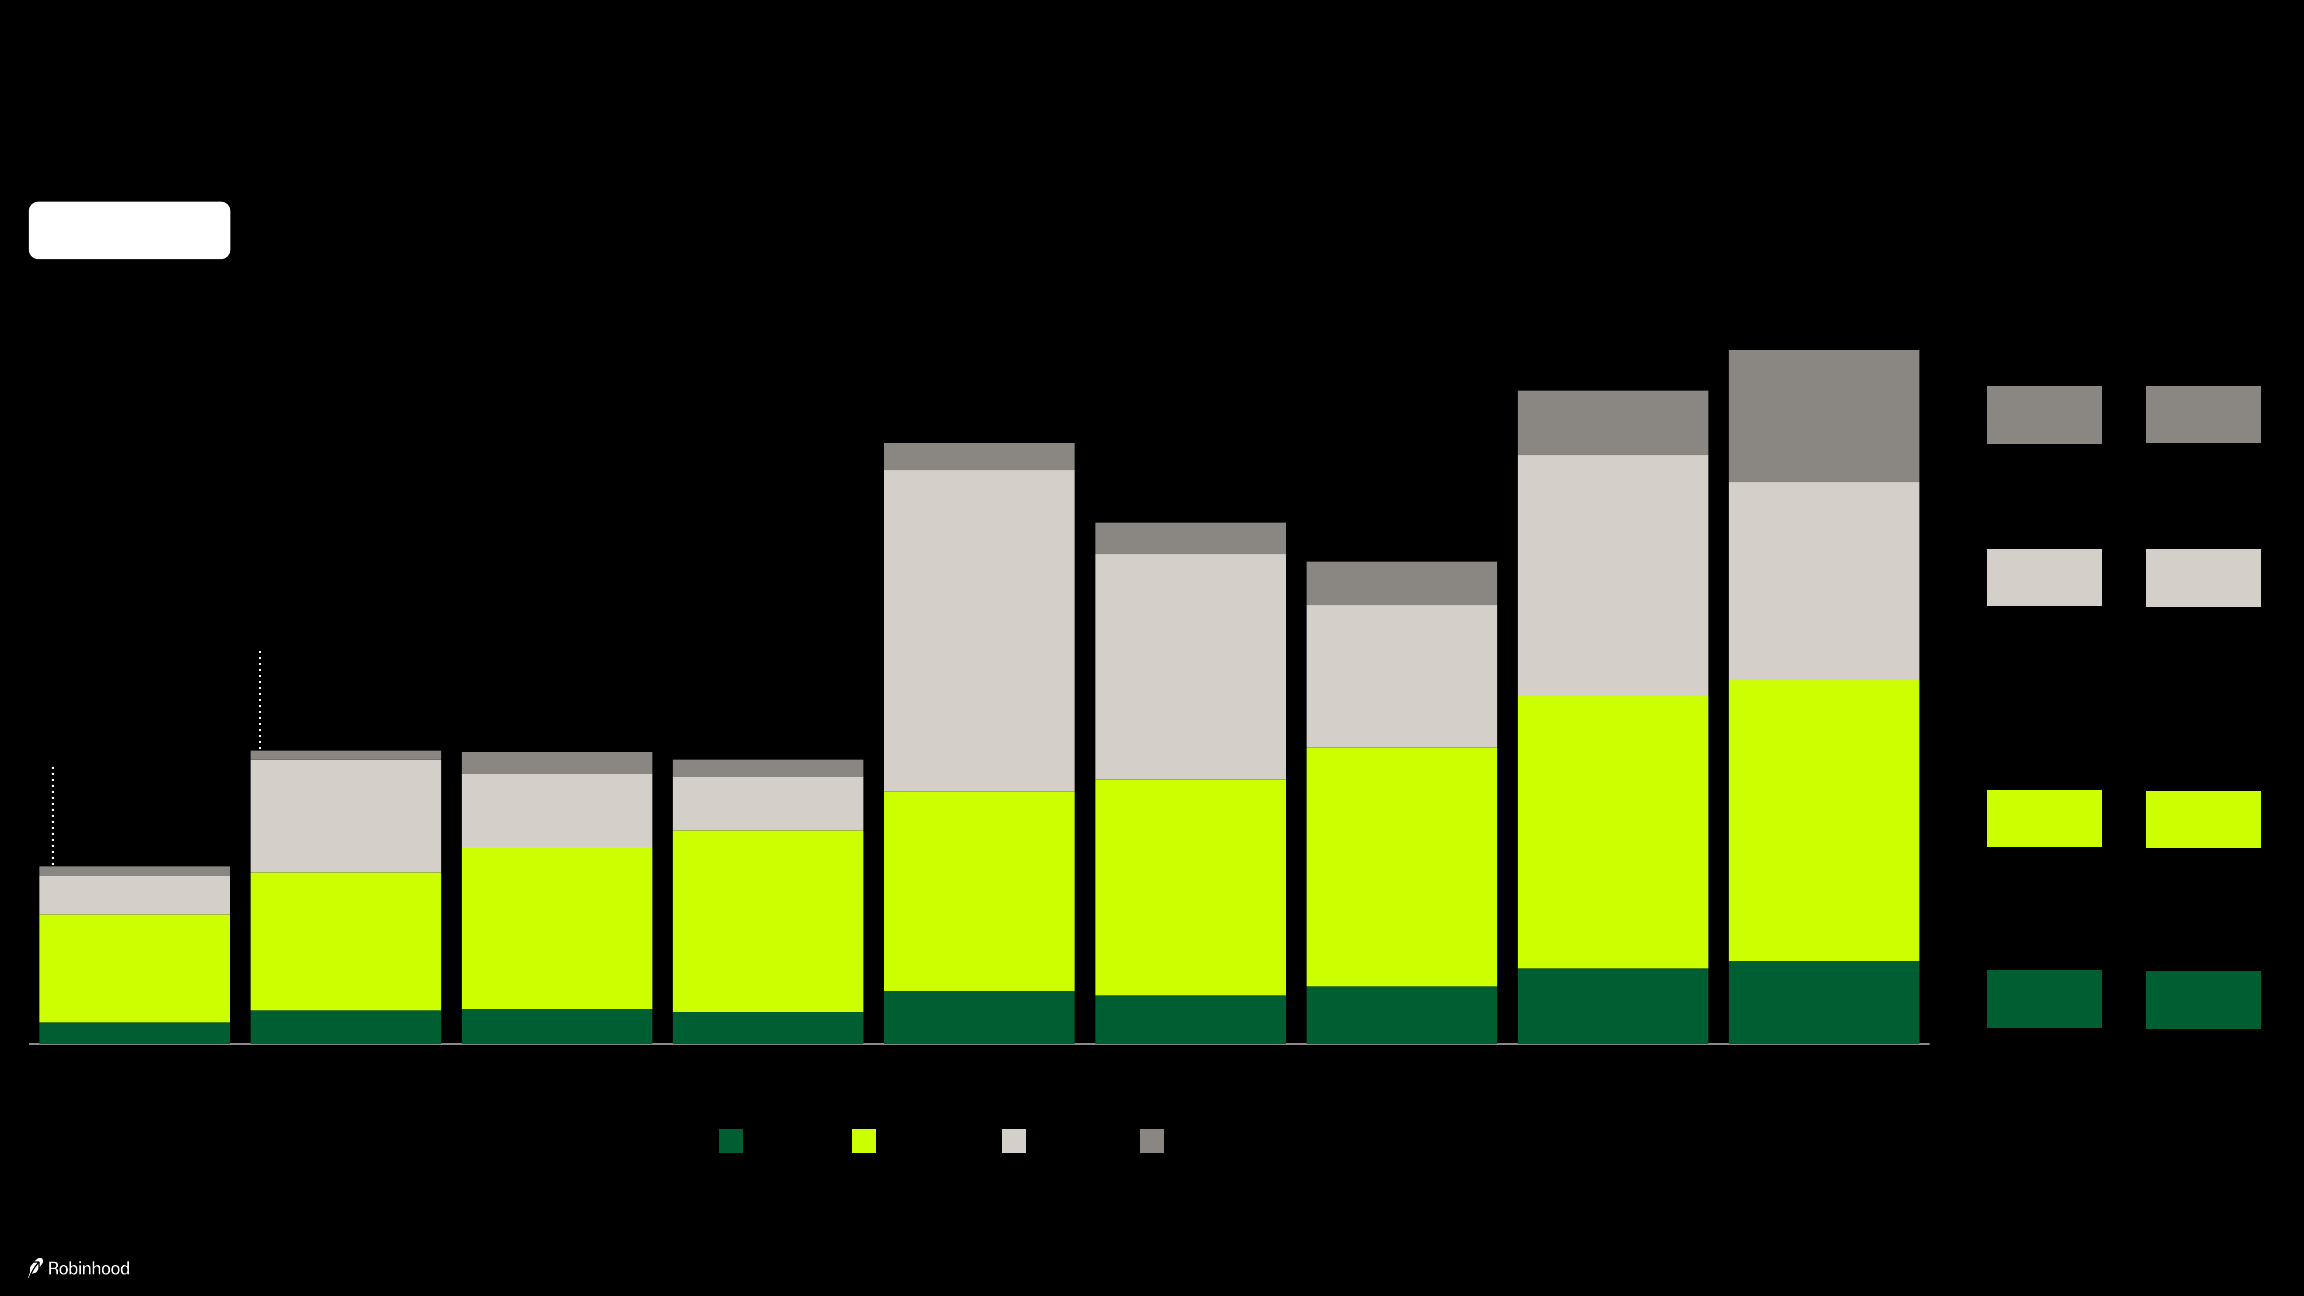
Total Platform Assets increased 68% year-over-year to $324 billion in Q4 due to continued Net Deposits, acquired assets, and higher equity valuations
In billions
Year-over-year change: +68% | Sequential change: (3%)
| Q4'23 | Q1'24 | Q2'24 | Q3'24 | Q4'24 | Q1'25 | Q2'25 | Q3'25 | Q4'25 | |
|---|---|---|---|---|---|---|---|---|---|
| Equities | $69 | $82 | $96 | $106 | $131 | $126 | $160 | $203 | $212 |
| Options and futures¹ | $1 | $1 | $1 | $1 | $2 | $1 | $2 | $4 | $3 |
| Cryptocurrencies | $15 | $26 | $21 | $20 | $35 | $28 | $41 | $51 | $40 |
| Net cash held by users | $18 | $21 | $22 | $25 | $25 | $25 | $33 | $33 | $27 |
| RIA Assets | — | — | — | — | — | $41 | $43 | $42 | $42 |
| Total | $103 | $130 | $140 | $152 | $193 | $221 | $279 | $333 | $324 |
Year-over-year / Sequential change by component:
| Component | Y/Y | Q/Q |
|---|---|---|
| Equities | +62% | +4% |
| Options and futures | NM | NM |
| Cryptocurrencies | +14% | (22%) |
| Net cash held by users | +5% | (18%) |
| RIA Assets | NM | +1% |
| Total | +68% | (3%) |
Q4 2025 ETF balances totaled ~$61 billion, representing 29% of total Q4 2025 equities under custody, up from 27% in Q4 2024.
Average Total Platform Assets per Funded Customer (in thousands)²
| Q4'23 | Q1'24 | Q2'24 | Q3'24 | Q4'24 | Q1'25 | Q2'25 | Q3'25 | Q4'25 |
|---|---|---|---|---|---|---|---|---|
| $4.4 | $5.4 | $5.8 | $6.3 | $7.7 | $8.6 | $10.5 | $12.4 | $12.0 |
Refer to the Appendix for changes in Total Platform Assets and details of net cash held by users. (1) Futures consists of futures, options on futures, swaps, and event contracts, which we launched during the fourth quarter of 2024. (2) Defined as end of period Total Platform Assets divided by end of period Funded Customers.
Robinhood Retirement AUC¹ grew to a record $26 billion in Q4
Robinhood Retirement Accounts (End of period, in thousands)
| Q4'23 | Q1'24 | Q2'24 | Q3'24 | Q4'24 | Q1'25 | Q2'25 | Q3'25 | Q4'25 |
|---|---|---|---|---|---|---|---|---|
| ~490 | ~650 | ~820 | ~940 | ~1,150 | ~1,320 | ~1,460 | ~1,630 | ~1,800 |
Up 1.6x (Q4'24 to Q4'25)
Robinhood Retirement AUC (End of period, in billions)
| Q4'23 | Q1'24 | Q2'24 | Q3'24 | Q4'24 | Q1'25 | Q2'25 | Q3'25 | Q4'25 |
|---|---|---|---|---|---|---|---|---|
| $1.7 | $4.2 | $8.7 | $9.9 | $13.1 | $14.4 | $19.0 | $24.2 | $26.5 |
Up >2.0x (Q4'24 to Q4'25)
Robinhood Retirement AUC per Account² (End of period, in thousands)
| Q4'23 | Q1'24 | Q2'24 | Q3'24 | Q4'24 | Q1'25 | Q2'25 | Q3'25 | Q4'25 |
|---|---|---|---|---|---|---|---|---|
| $3.5 | $6.5 | $10.6 | $10.5 | $11.4 | $10.9 | $13.0 | $14.8 | $14.7 |
(1) Does not include TradePMR. (2) Defined as end of period Robinhood Retirement AUC divided by the total number of traditional IRAs and Roth IRAs at the end of the period.
We continue to add value to Robinhood Gold, and Robinhood Gold Subscribers grew to a record 4.2 million in Q4, representing over 15% of Funded Customers
Robinhood Gold Subscribers receive meaningful value for $5 per month¹
| Feature | Benefit |
|---|---|
| High-Yield Cash | 3.25% APY on uninvested cash; Up to $2.5M FDIC insurance through the Cash Sweep Program |
| Retirement | 3% IRA match |
| Trading | Lower index options contract fees ($0.35 vs. $0.50 for non-Gold)²; Lower futures commissions ($0.50 vs. $0.75 for non-Gold)²; First $1,000 of margin free |
| Research | Professional research reports |
| Gold Card³ | 3% cash back on all categories |
| Robinhood Strategies | Management fees capped at $250 per year |
| Robinhood Cortex⁴ | Stock and Crypto Digests, Portfolio Digests; Trade Builder (coming soon); Custom indicators and scanners (coming soon); Assistant (coming soon) |
| Robinhood Banking⁴ | Private banking experience with checking and savings, digital wealth app, and additional perks; 3.5% APY on cash; Up to $2.5M FDIC insurance |
| Exclusive Mortgage Rates⁵ | 0.75%+ discount to average mortgage rate and $500 closing cost credit through Sage Home Loans |
Robinhood Gold Subscribers (In millions)
Q4 2025: 4.18M | +58% (+1.5M) Y/Y | +8% (+300k) Q/Q
| Q4'23 | Q1'24 | Q2'24 | Q3'24 | Q4'24 | Q1'25 | Q2'25 | Q3'25 | Q4'25 |
|---|---|---|---|---|---|---|---|---|
| 1.42 | 1.68 | 1.98 | 2.19 | 2.64 | 3.19 | 3.48 | 3.88 | 4.18 |
Robinhood Gold Adoption Rate⁶:
| Q4'23 | Q1'24 | Q2'24 | Q3'24 | Q4'24 | Q1'25 | Q2'25 | Q3'25 | Q4'25 |
|---|---|---|---|---|---|---|---|---|
| 6.1% | 7.0% | 8.2% | 9.0% | 10.5% | 12.4% | 13.1% | 14.5% | 15.5% |
Annualized Robinhood Gold Subscription Revenue⁷ (in millions)
| Q4'23 | Q1'24 | Q2'24 | Q3'24 | Q4'24 | Q1'25 | Q2'25 | Q3'25 | Q4'25 |
|---|---|---|---|---|---|---|---|---|
| $83 | $90 | $104 | $112 | $128 | $152 | $176 | $188 | $200 |
Compared to our average Funded Customer⁸, our average Robinhood Gold Subscriber has...
- ~5x Assets Under Custody⁸
- ~1.2x Net Deposit Growth Rate⁸
- ~3.3x Robinhood Retirement Adoption Rate⁸
(1) Robinhood Gold offering and pricing as of 2/9/2026. (2) Other fees may apply when trading futures and index options. (3) The Robinhood Gold Card is currently rolling out via a waitlist. (4) Robinhood Banking and Robinhood Cortex Portfolio Digests are currently rolling out to Gold Subscribers. Robinhood Cortex Trade Builder, custom indicators and scanners, and Assistant are not yet available to customers. (5) Sage Home Loans Corporation NMLS ID #3304 is not affiliated with any Robinhood entity. Robinhood is not a lender. Average based on a customer's loan scenario, informed by the Mortgage News Daily national average. (6) Defined as end of period Robinhood Gold Subscribers divided by end of period Funded Customers. (7) Defined as Robinhood Gold subscription revenue in a given quarter times four. (8) Comparisons exclude Funded Customers who solely use X1, TradePMR or Bitstamp. Assets Under Custody and Robinhood Retirement Adoption Rate figures as of 12/31/2025. Net Deposit growth rate over the LTM ending 12/31/2025. Refer to definitions in the Appendix for growth rate calculations.
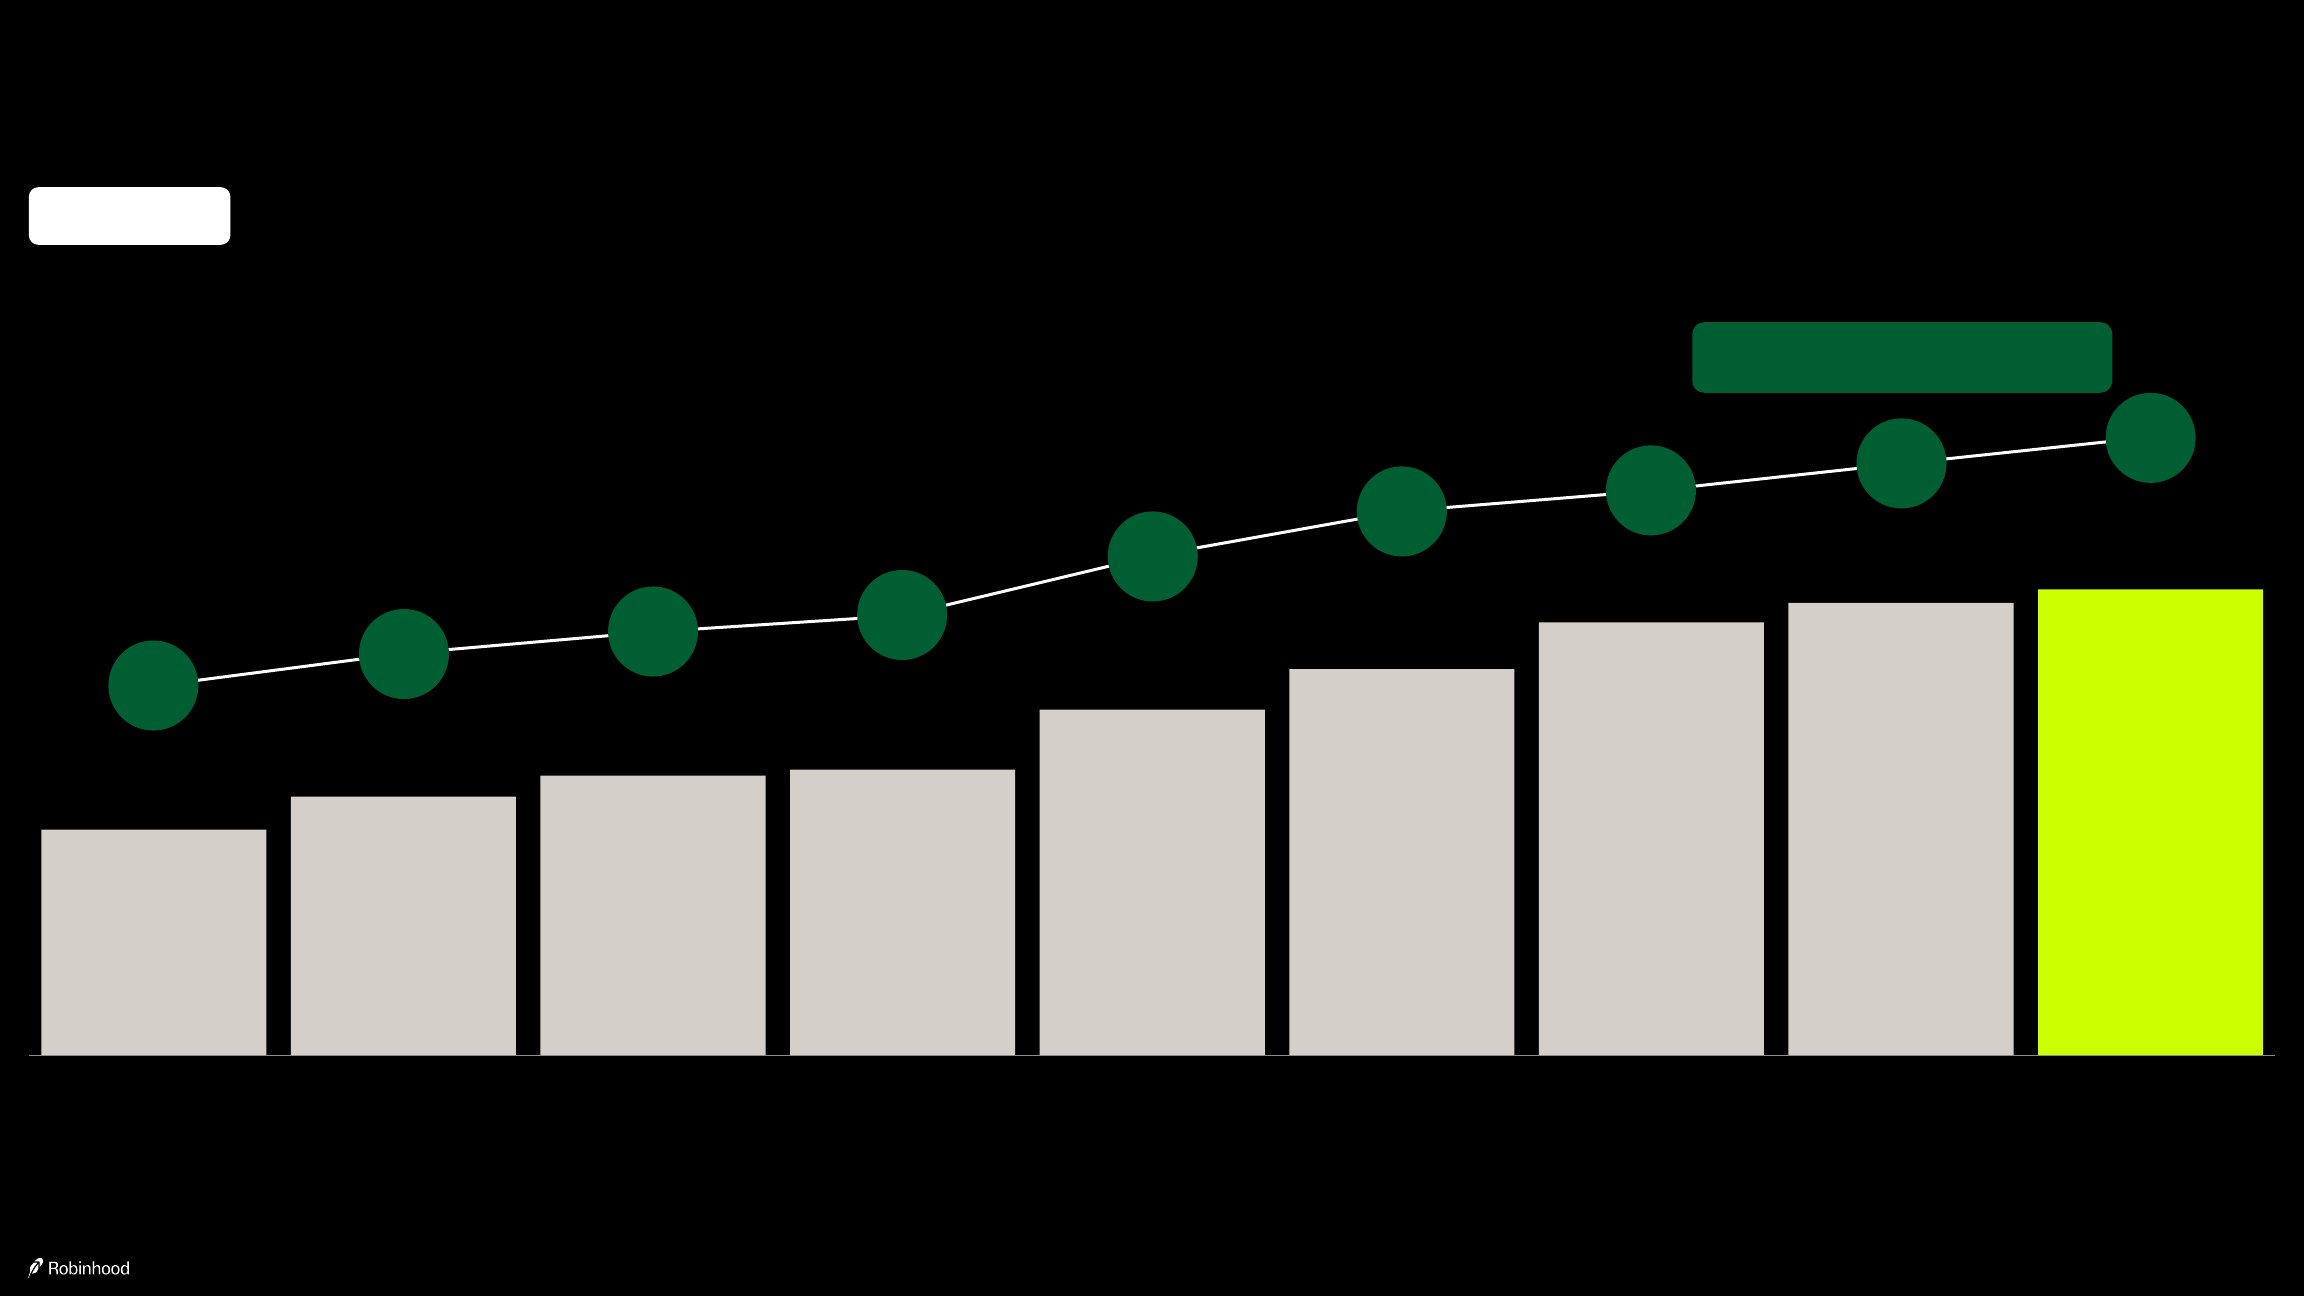
Net Deposits were $15.9 billion in Q4, translating to a 19% annualized growth rate, and were ~$68 billion over the last twelve months, translating to a 35% growth rate
In billions
Last twelve months Net Deposits: $68.1 Last twelve months growth rate: 35%
| Q4'23 | Q1'24 | Q2'24 | Q3'24 | Q4'24 | Q1'25 | Q2'25¹ | Q3'25 | Q4'25 |
|---|---|---|---|---|---|---|---|---|
| $4.6 | $11.2 | $13.2 | $10.0 | $16.1 | $18.0 | $13.8 | $20.4 | $15.9 |
Annualized Growth Rate²:
| Q4'23 | Q1'24 | Q2'24 | Q3'24 | Q4'24 | Q1'25 | Q2'25 | Q3'25 | Q4'25 |
|---|---|---|---|---|---|---|---|---|
| 21% | 44% | 41% | 29% | 42% | 37% | 25% | 29% | 19% |
(1) Starting in June 2025, Net Deposits include results from Bitstamp, which we acquired on 6/2/2025. Net Deposits do not include results from TradePMR. Q4 2025 Net Deposits of $15.9B included the net effect of ~$5.8B ACATS In and ~$2.2B ACATS Out. Automated Customer Account Transfer Service ("ACATS") is a system that automates and standardizes procedures for the transfer of assets in a customer account from one brokerage firm and / or bank to another. (2) Refer to definitions in the Appendix for details on growth rate calculations.
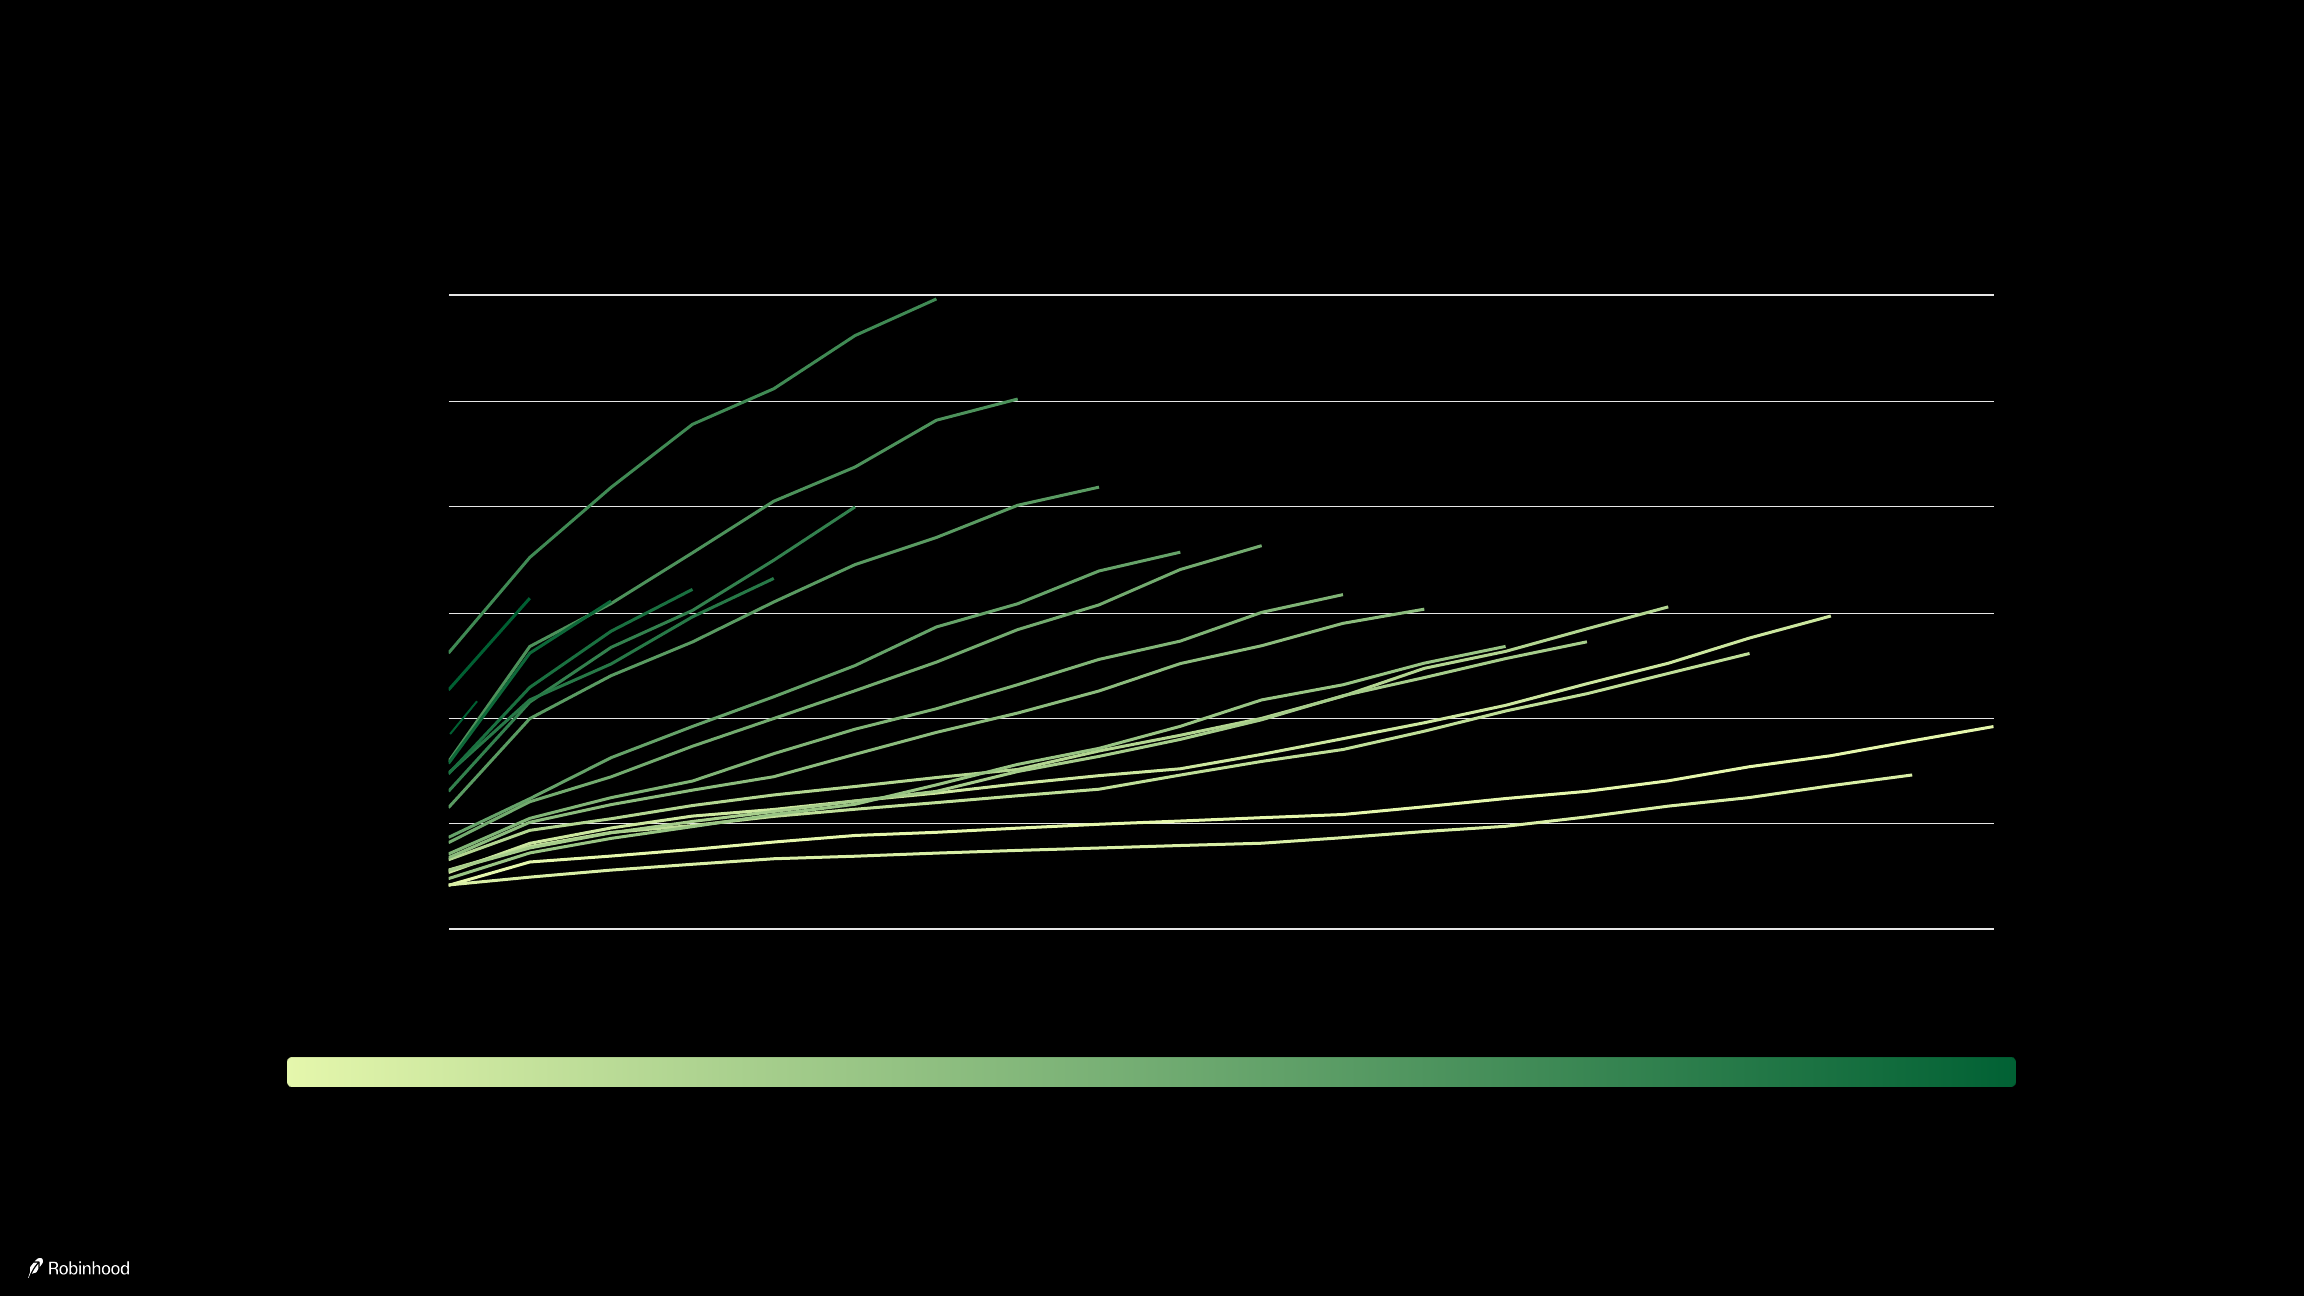
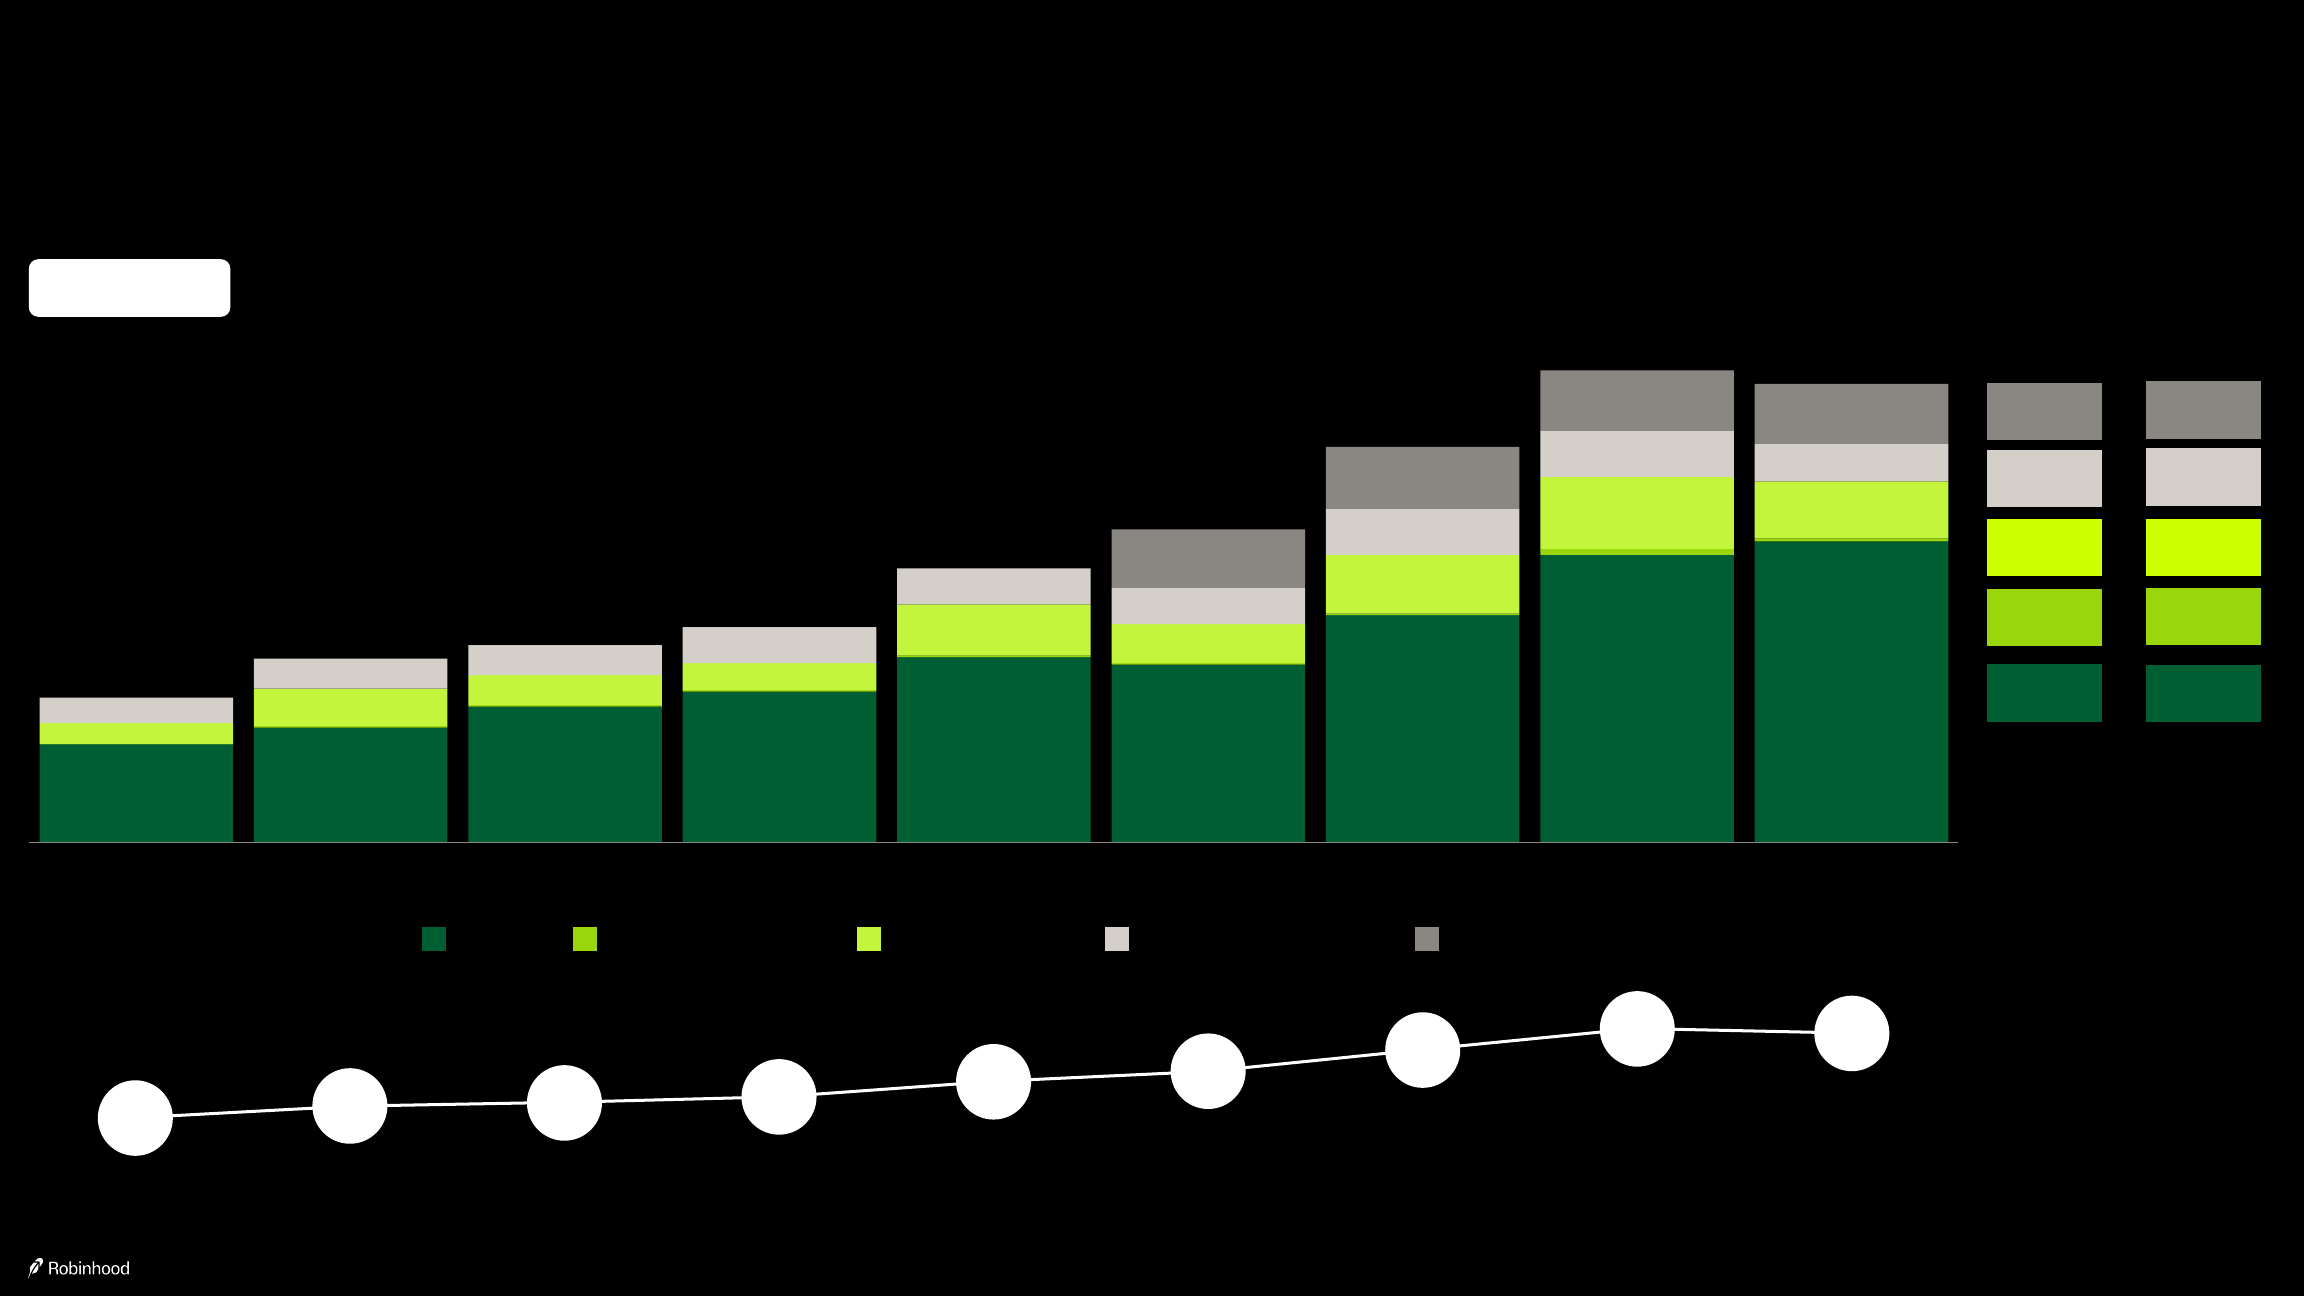
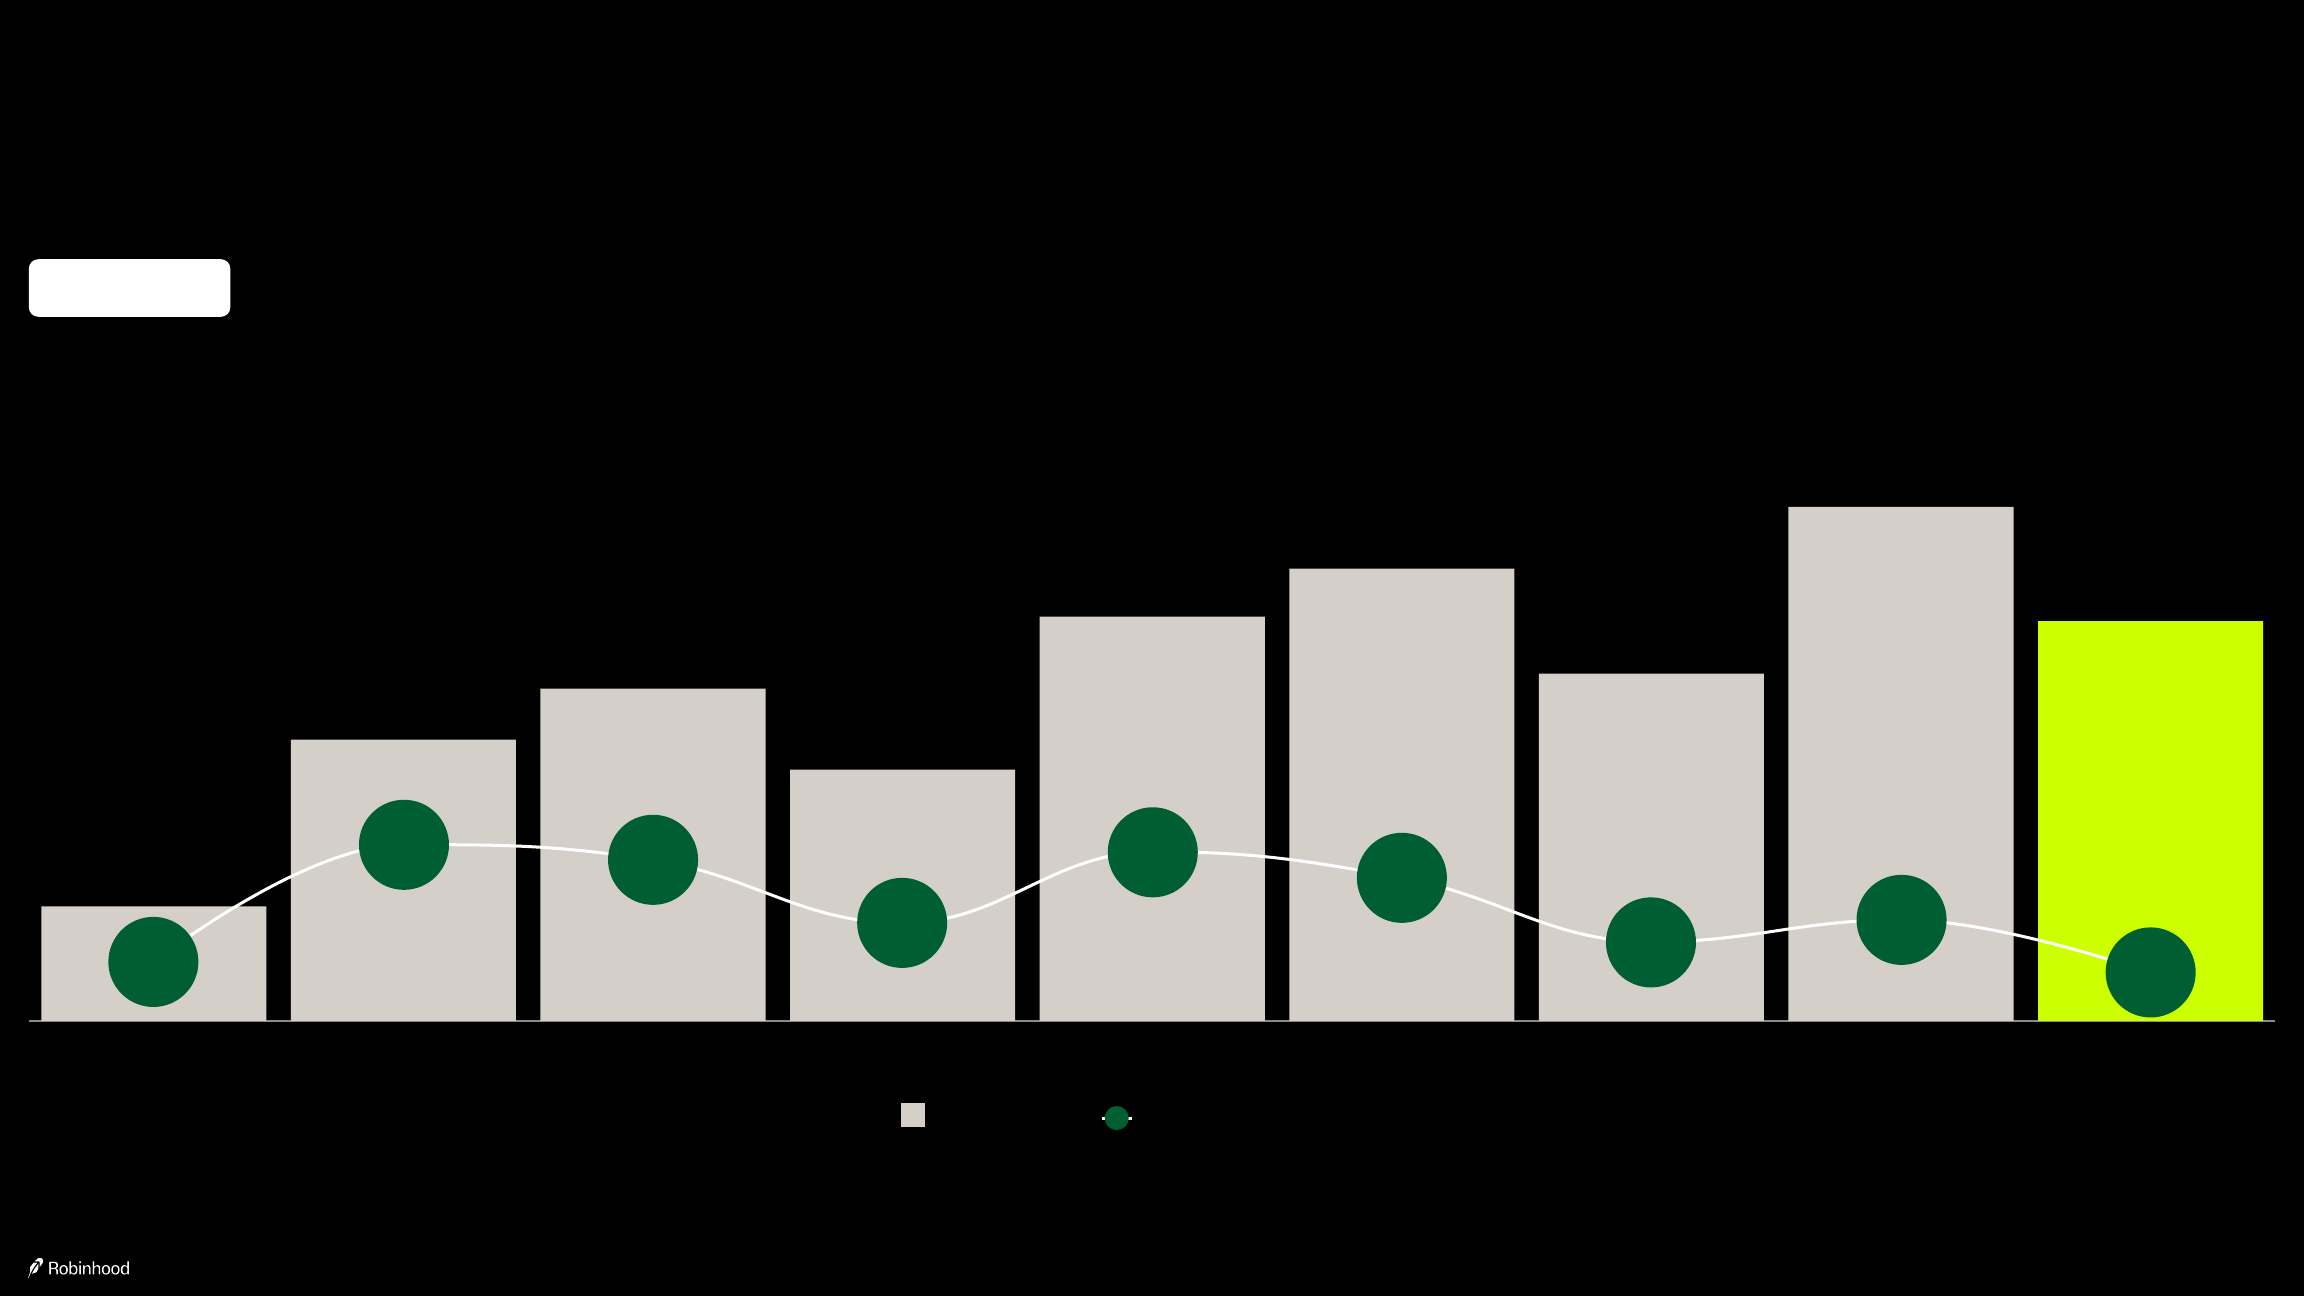
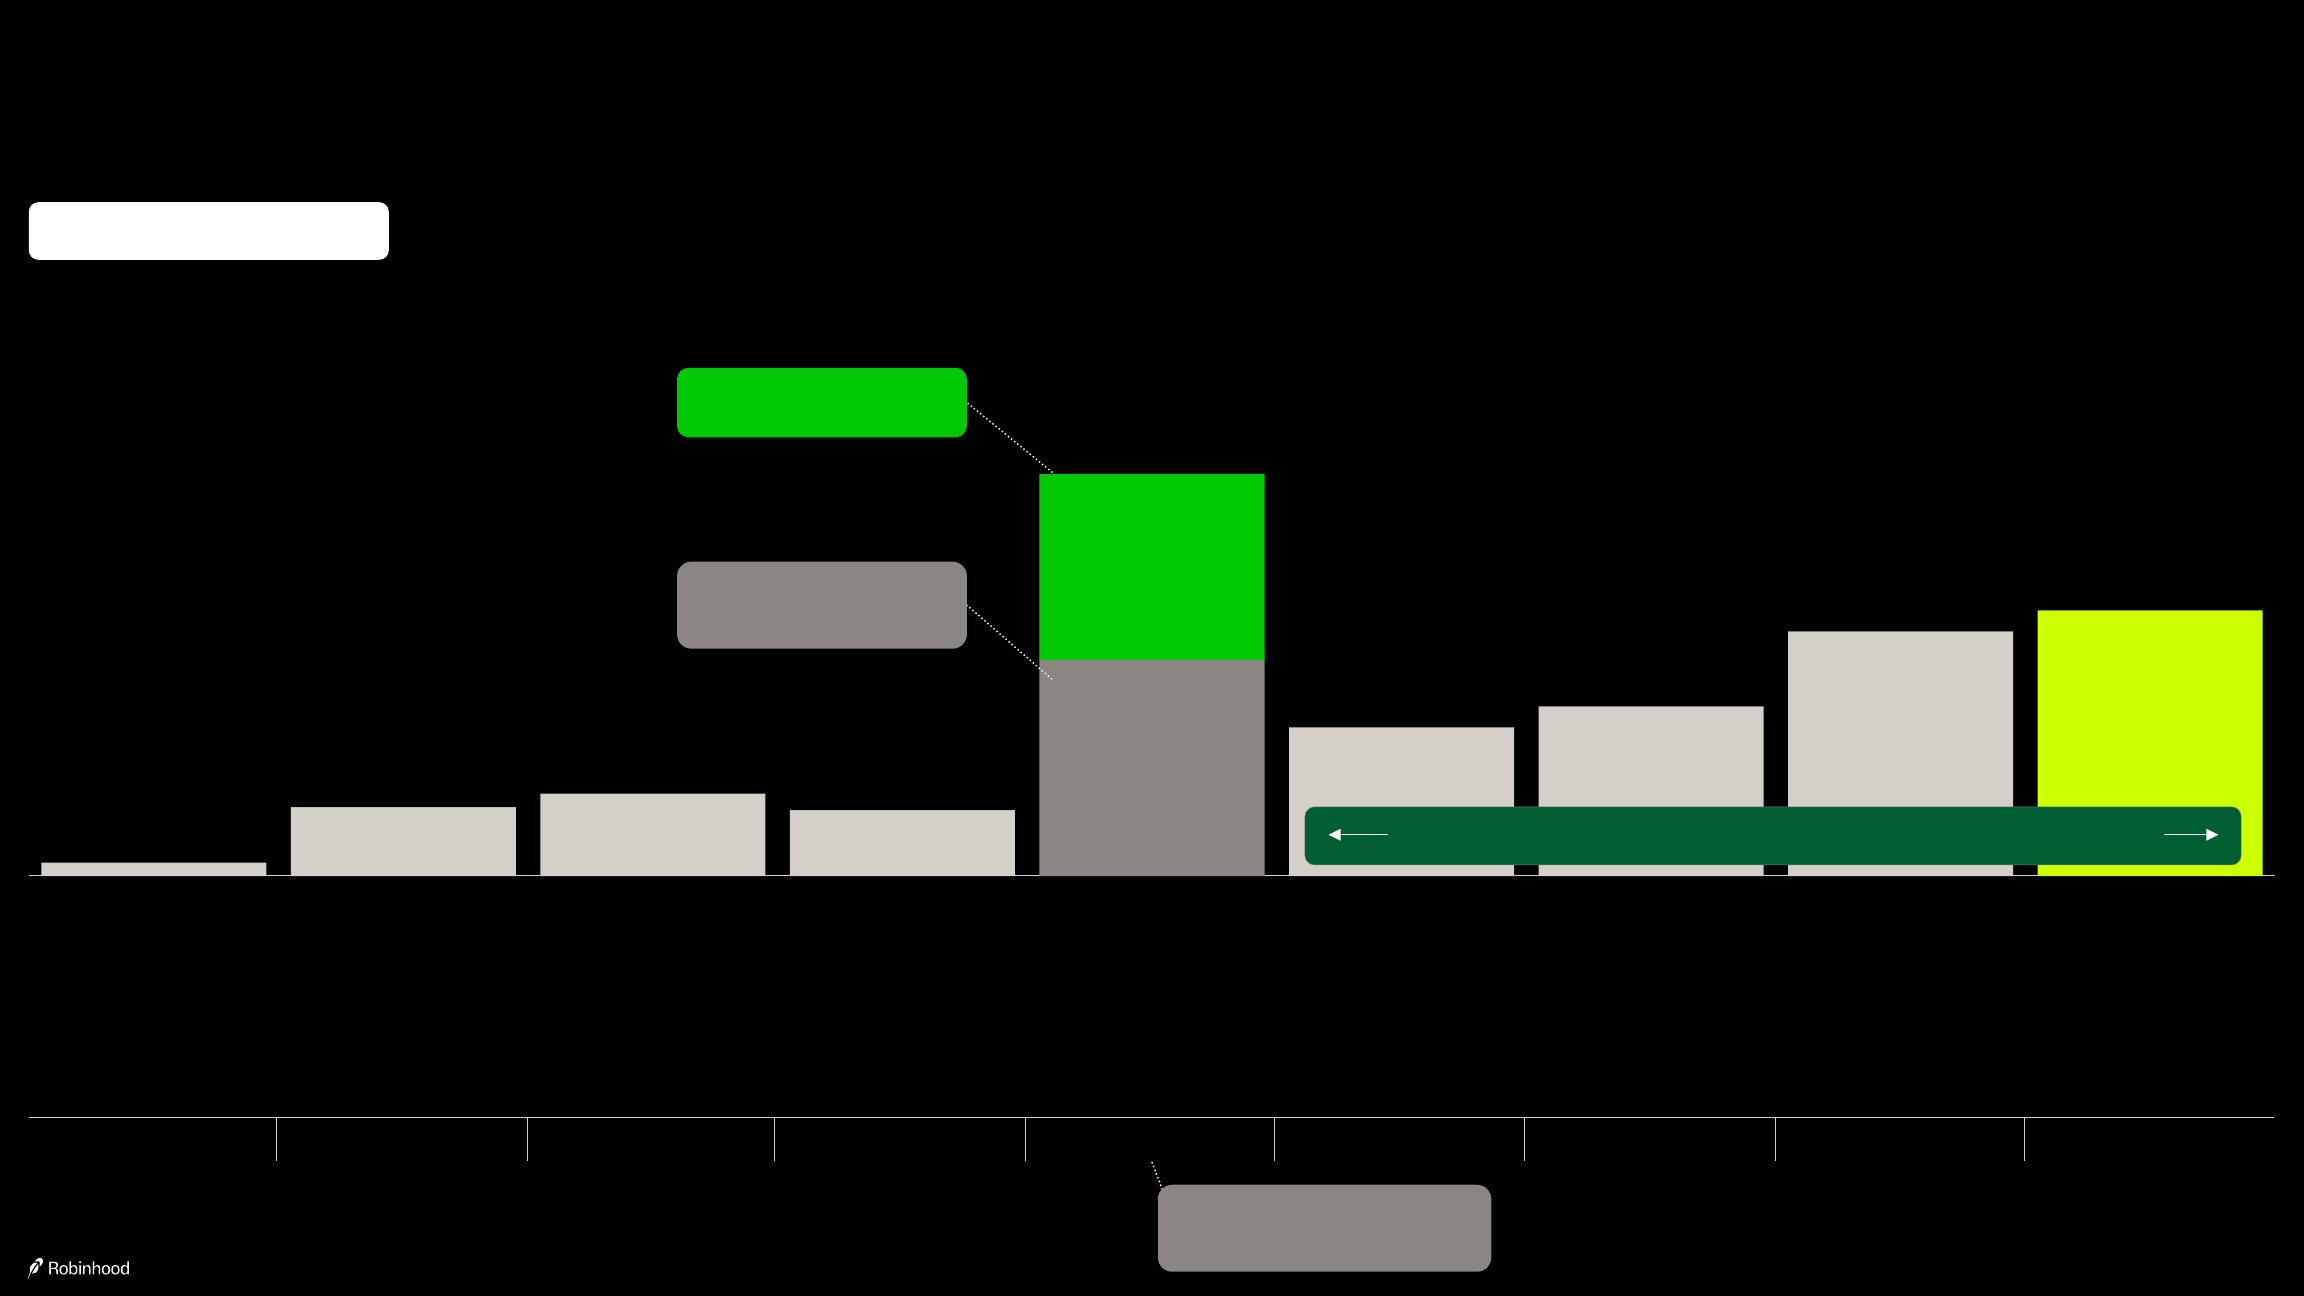
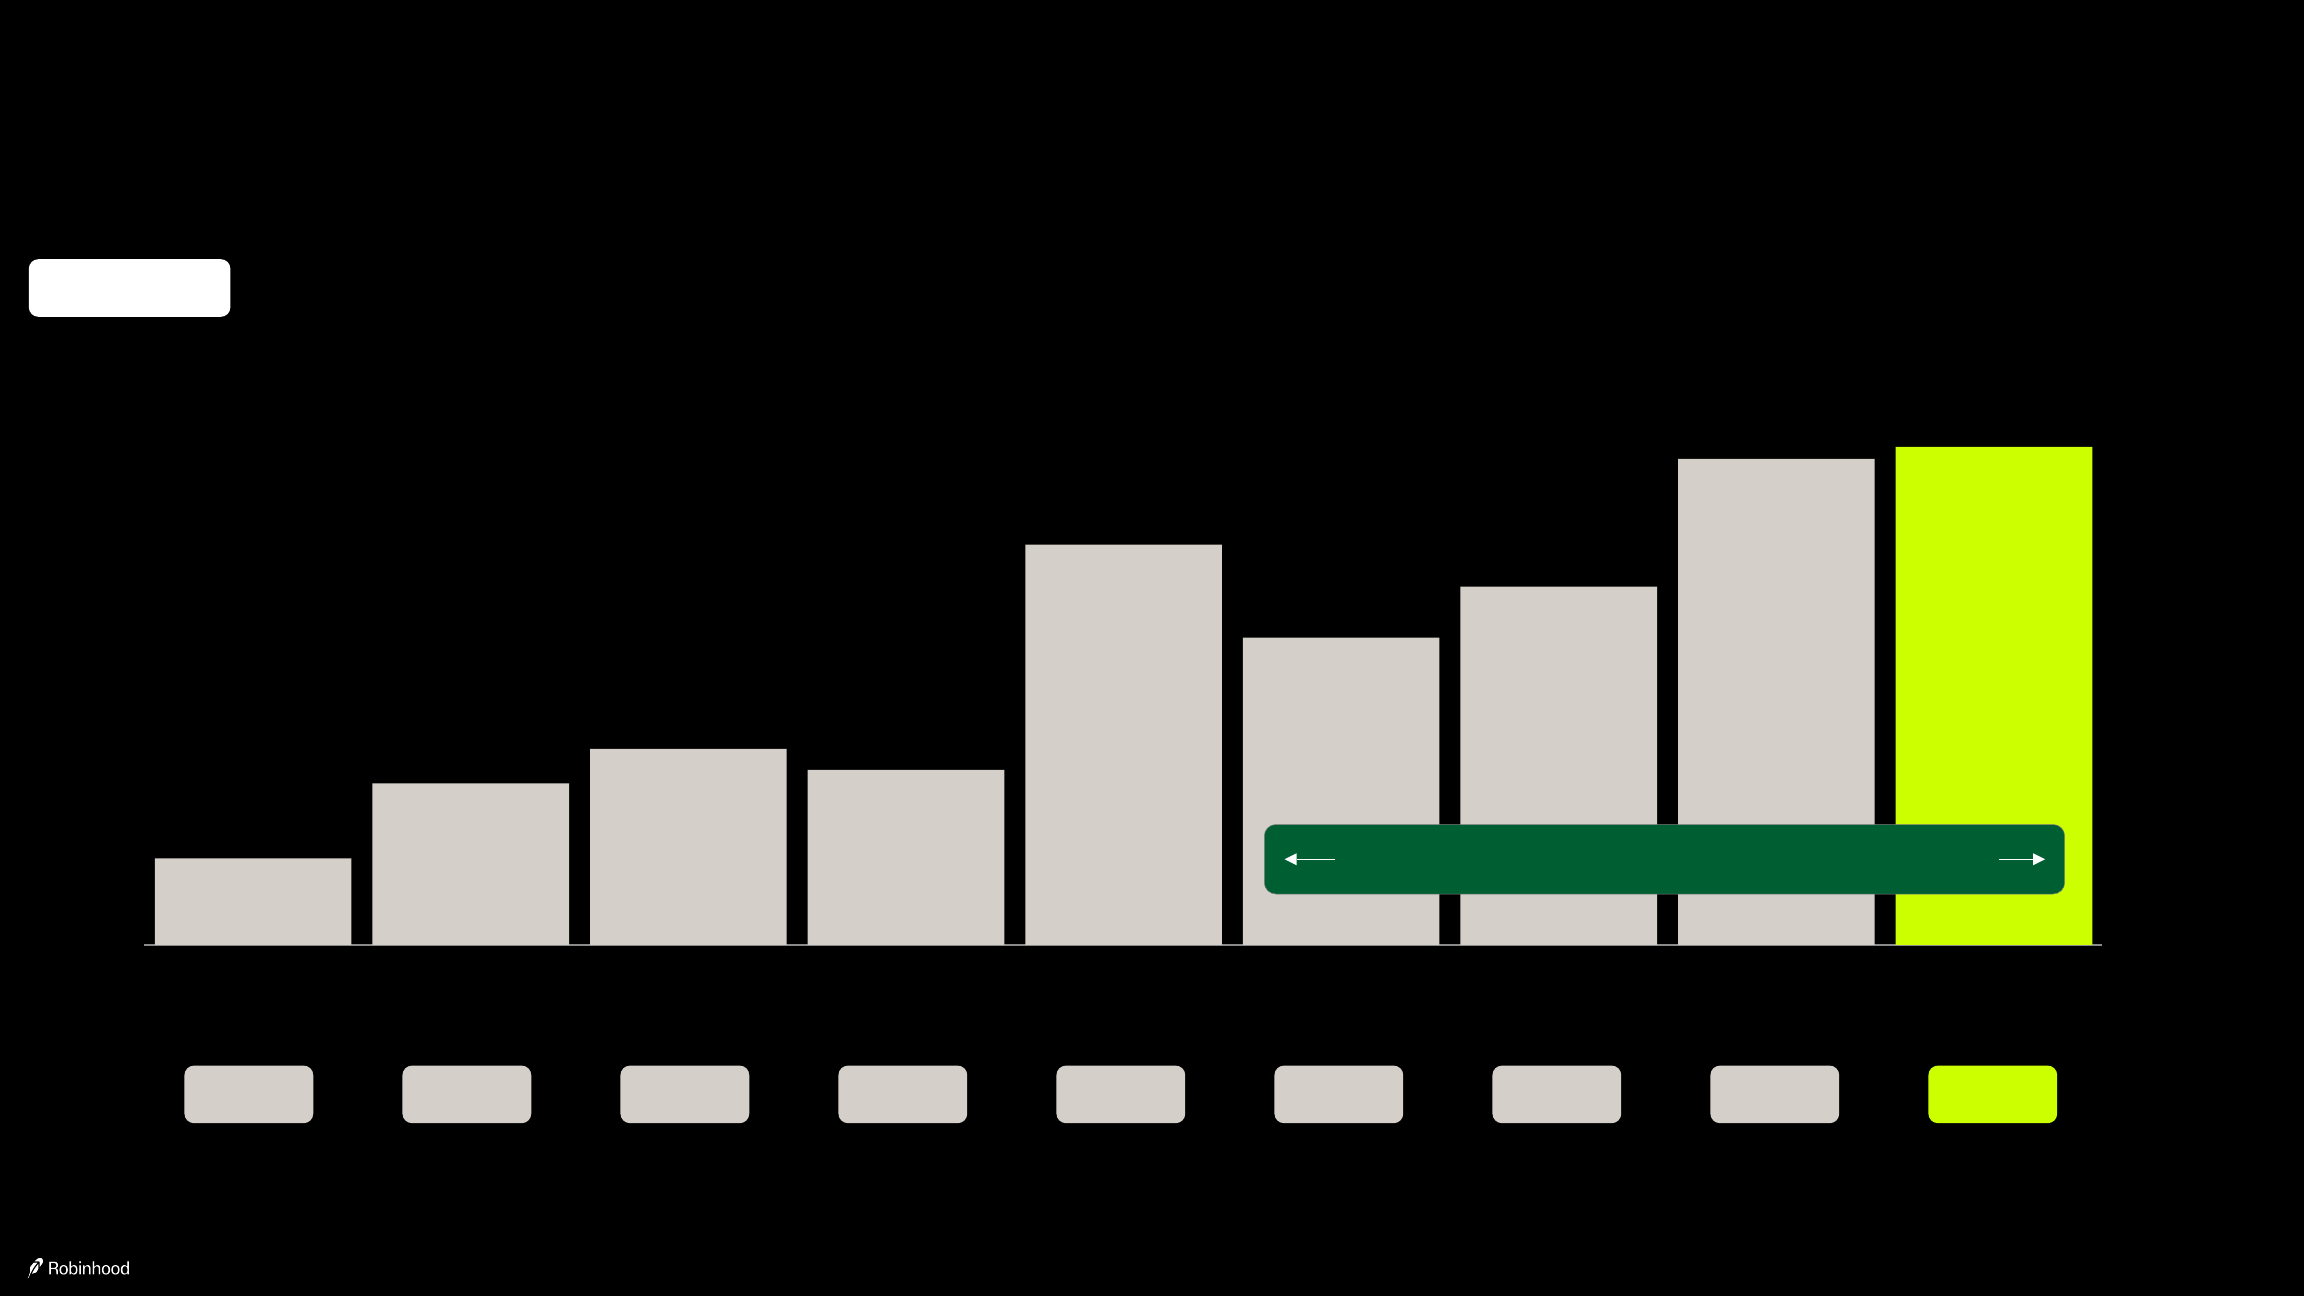
Average cumulative Net Deposits¹ have grown over time across our Funded Customer Cohorts², and recent cohorts' initial Net Deposits are larger
Funded Customer Cohorts reflect quarterly cohorts, from Q1 2021 through Q4 2025. Comparisons exclude Funded Customers who solely use X1, TradePMR or Bitstamp. (1) "Average cumulative Net Deposits" defined as total cumulative Net Deposits from a cohort divided by the cohort size. (2) A "Funded Customer Cohort" comprises end of period Funded Customers who were first considered a New Customer in a given quarter.
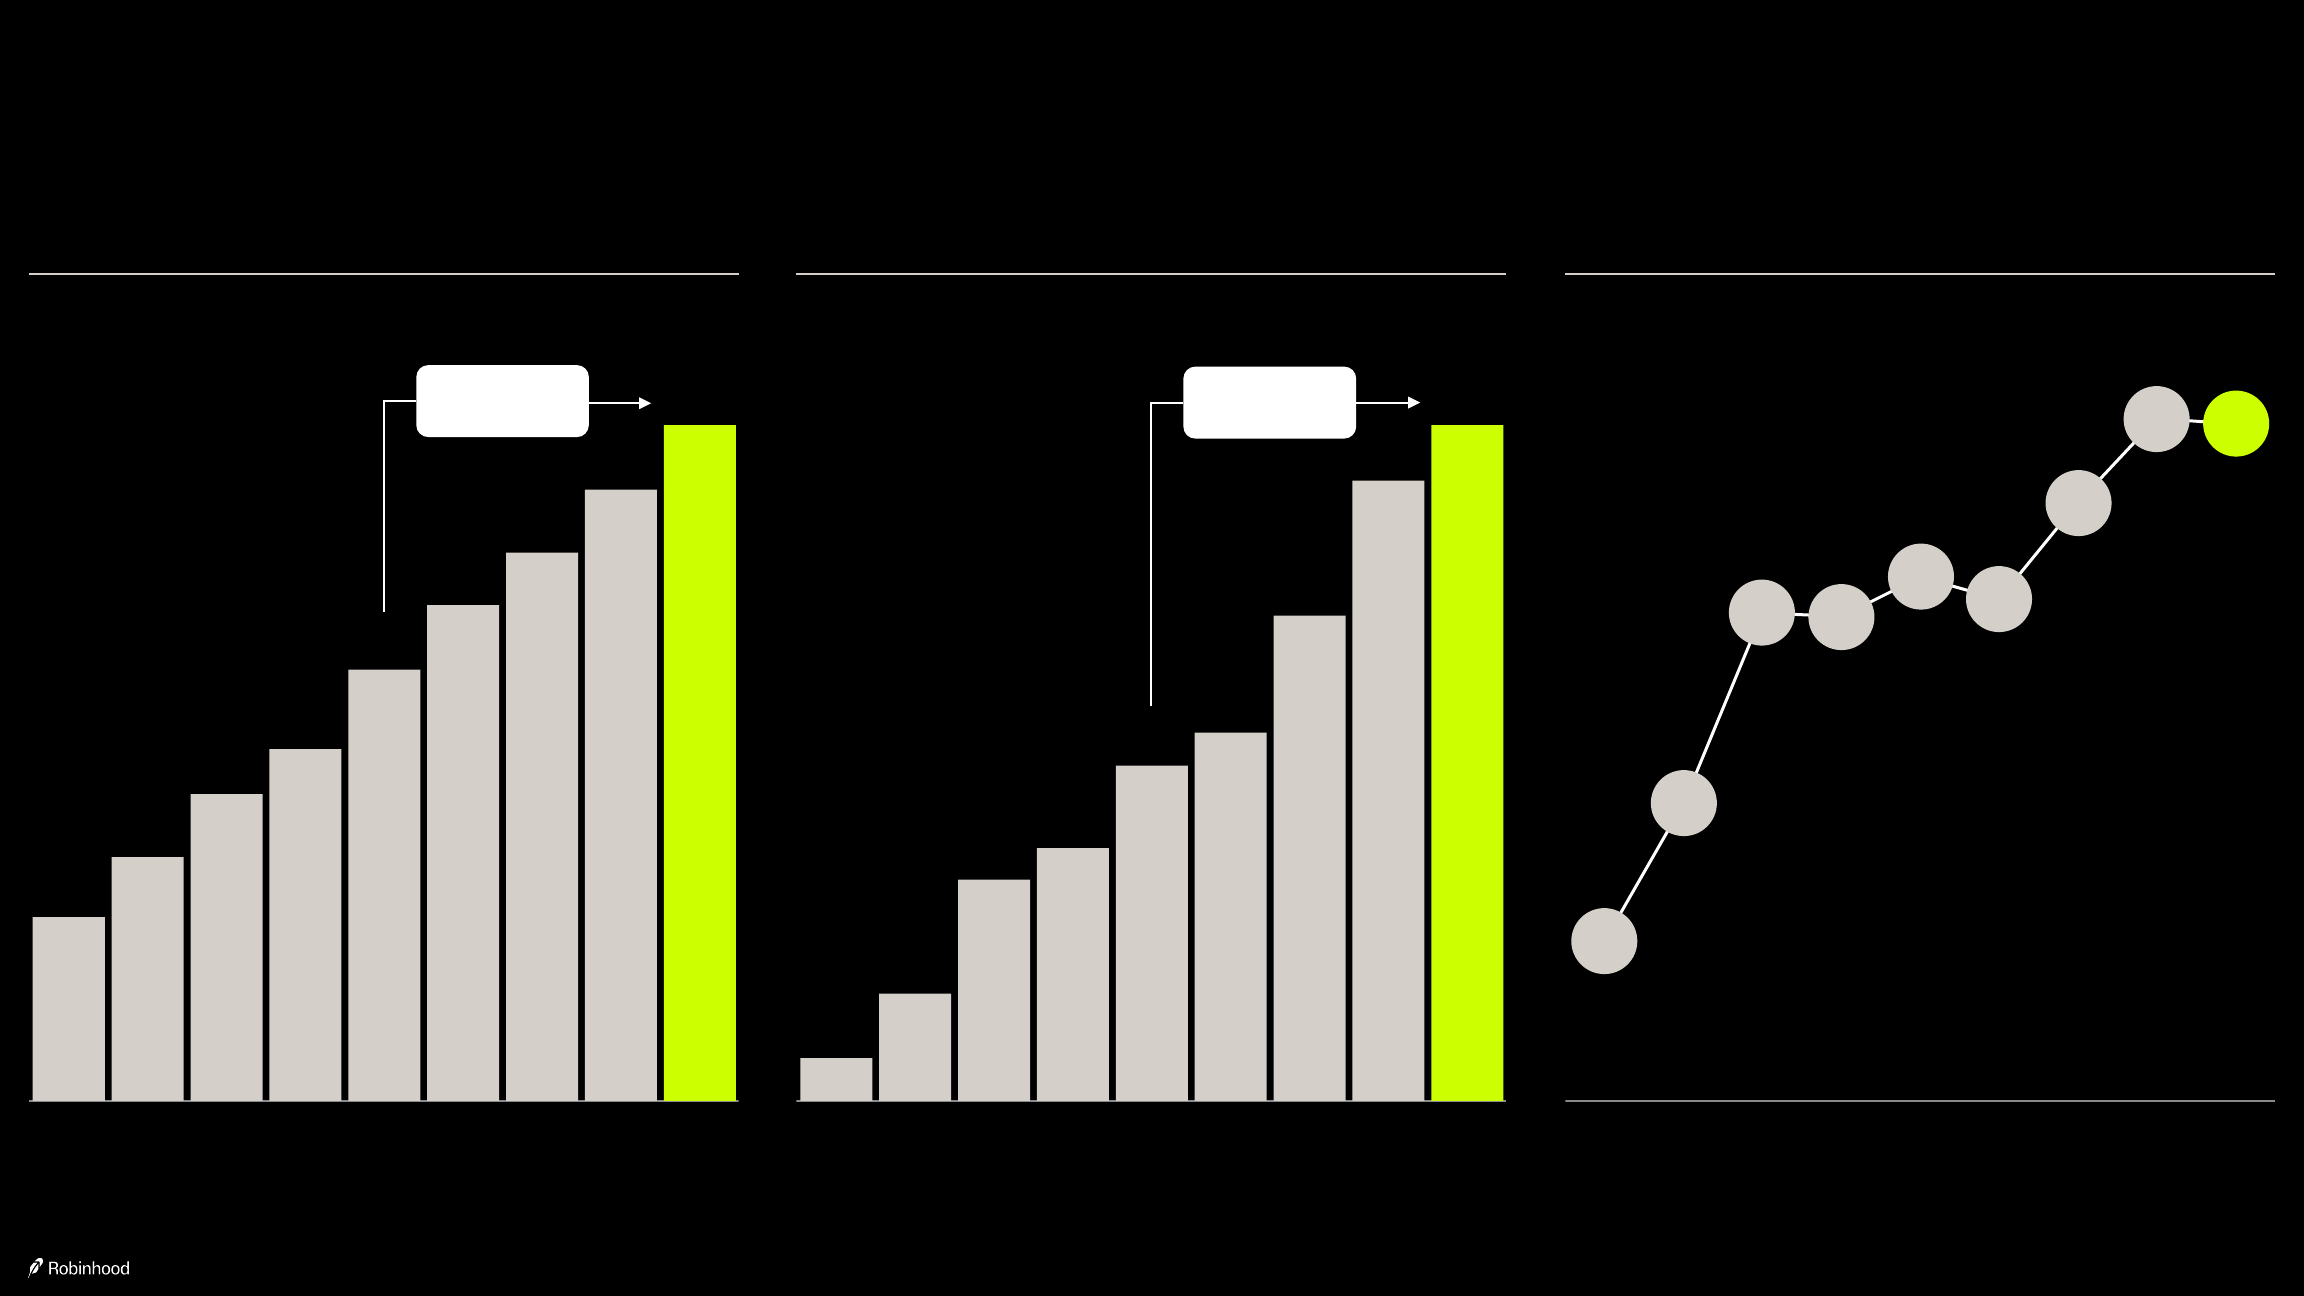
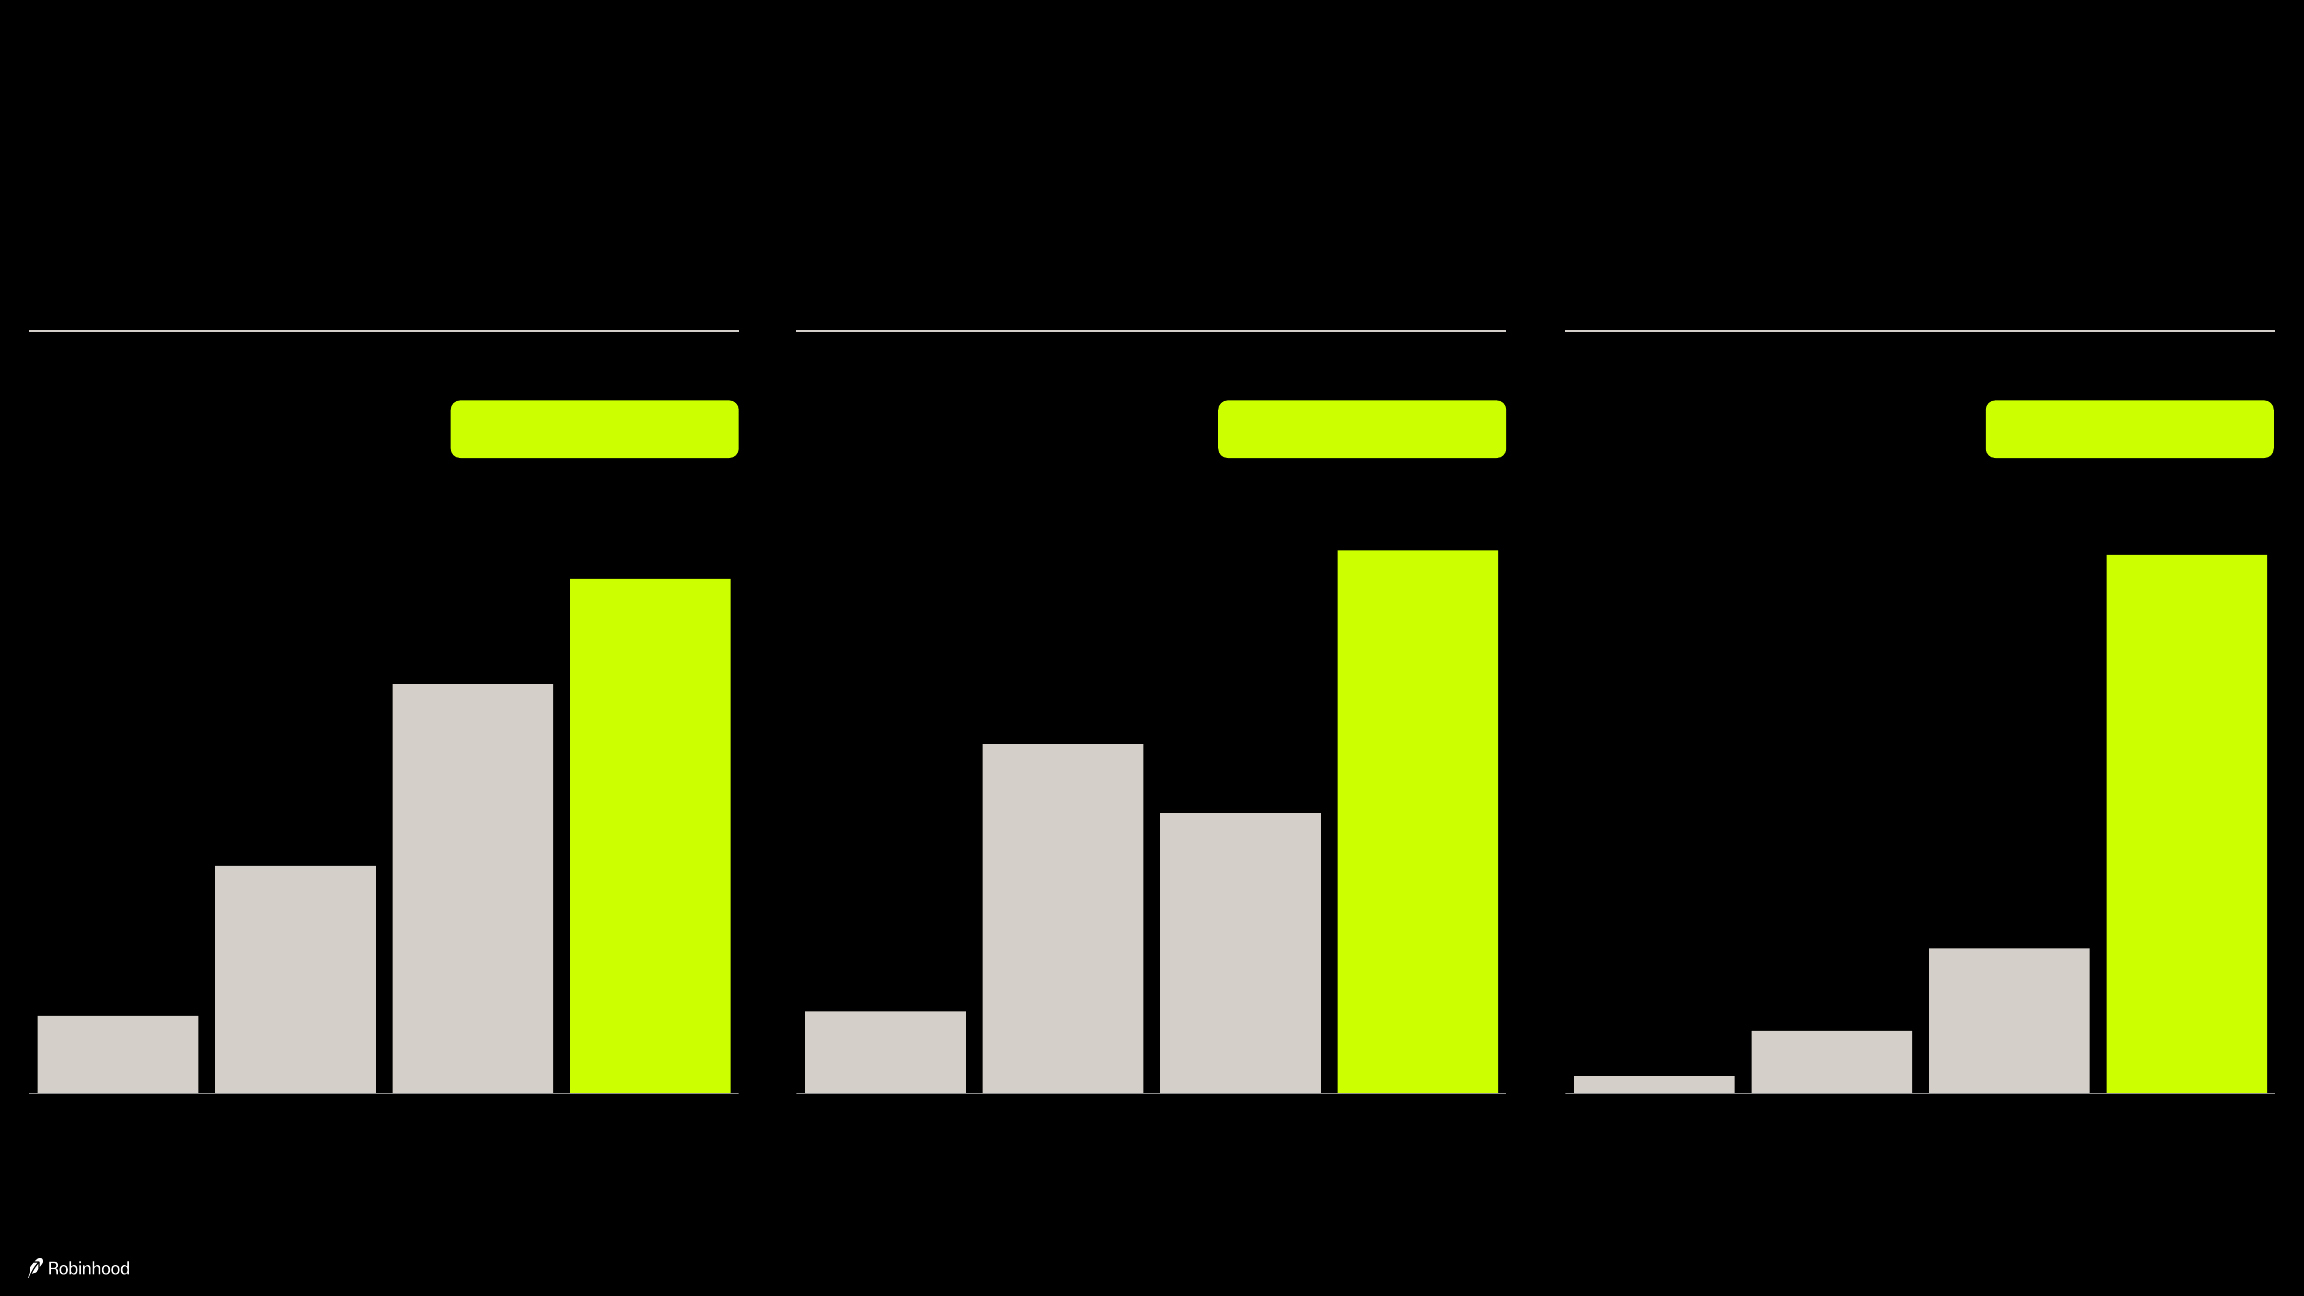
We've continued to gain market share over time
Equities Market Share¹ | +44% year-over-year
| 2022 | 2023 | 2024 | 2025 |
|---|---|---|---|
| 0.45% | 0.51% | 0.77% | 1.11% |
Up 147% (2022 to 2025)
Options Market Share² | +10% year-over-year
| 2022 | 2023 | 2024 | 2025 |
|---|---|---|---|
| 4.4% | 5.2% | 6.8% | 7.5% |
Up 70% (2022 to 2025)
Crypto Market Share³ | +63% year-over-year
| 2022 | 2023 | 2024 | 2025 |
|---|---|---|---|
| 0.54% | 0.51% | 0.76% | 1.24% |
Up 130% (2022 to 2025)
Margin Market Share⁴ | +75% year-over-year
| 2022 | 2023 | 2024 | 2025 |
|---|---|---|---|
| 0.62% | 0.50% | 0.64% | 1.12% |
Up 81% (2022 to 2025)
Refer to Appendix for definitions. (1) Defined as Robinhood Equity Notional Volumes divided by Total US Equity Notional Volumes from CBOE over a given period. (2) Defined as Robinhood Options Contracts Traded divided by the sum of Equity and Non-Equity Options Contracts from OCC times two over a given period. (3) Defined as Crypto Notional Volumes divided by Total Cryptocurrency Exchange Volume from The Block over a given period. Refer to Appendix for the definition of Notional Trading Volume. (4) Defined as average Robinhood Margin Book divided by average Debit Balances in Customers' Securities Margin Accounts from FINRA over a given period.
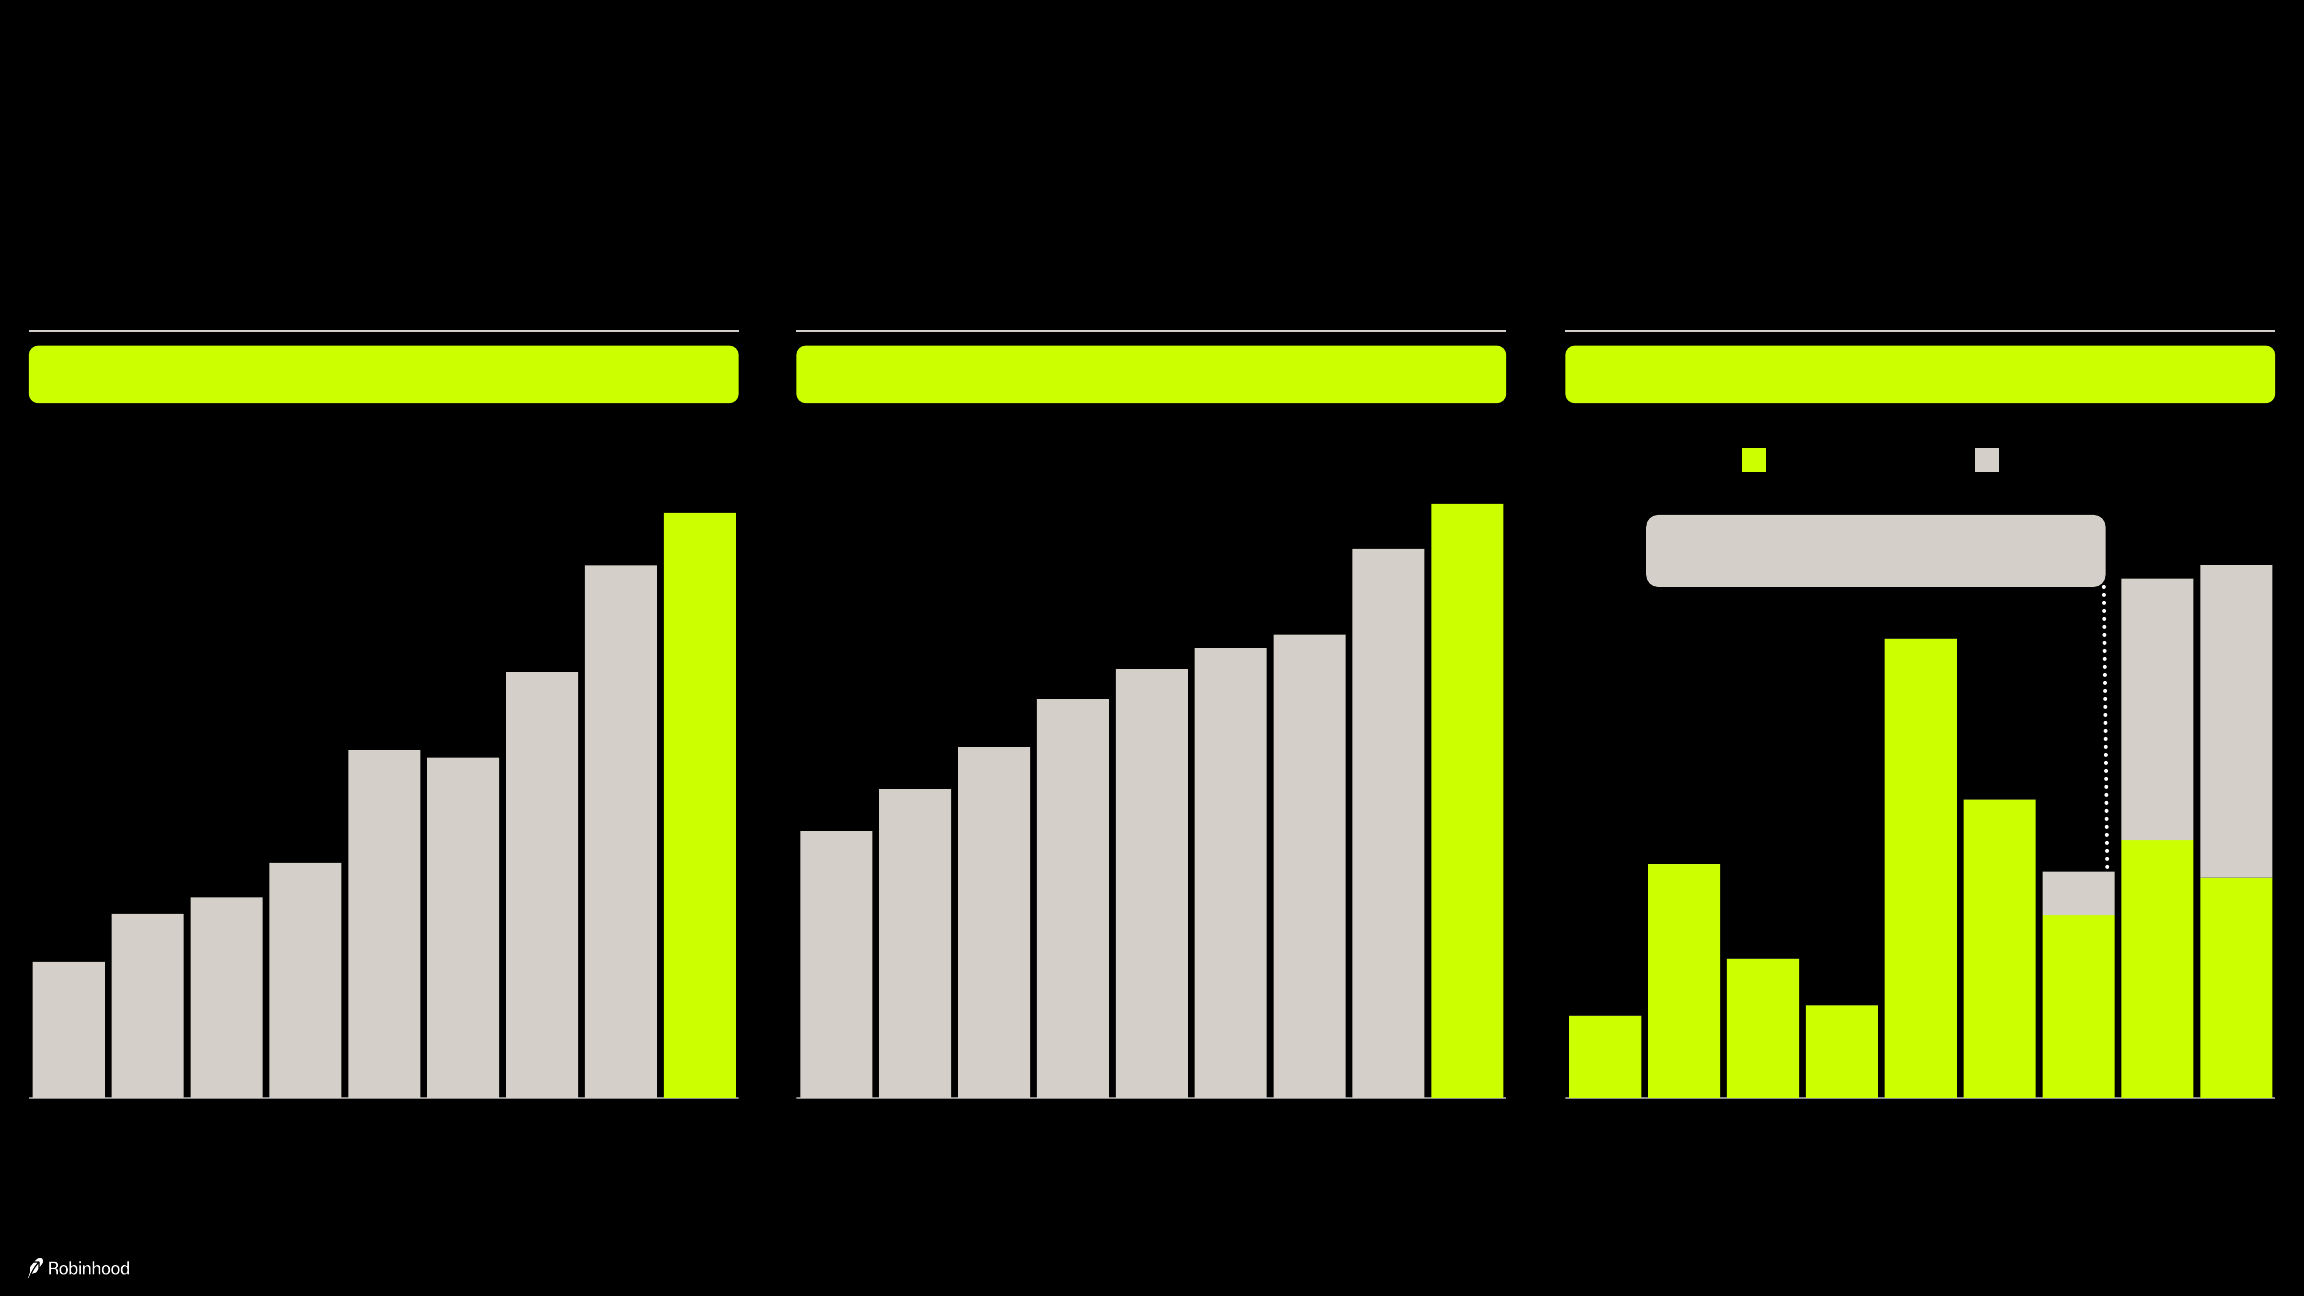
Q4 trading volumes increased significantly year-over-year as we've continued to gain market share, and Equities and Options reached new quarterly records
Equity Notional Volumes (In $ billions) — Up 68% Y/Y and up 10% Q/Q
| Q4'23 | Q1'24 | Q2'24 | Q3'24 | Q4'24 | Q1'25 | Q2'25 | Q3'25 | Q4'25 |
|---|---|---|---|---|---|---|---|---|
| 167 | 225 | 244 | 286 | 423 | 413 | 517 | 647 | 710 |
Options Contracts Traded (In millions of contracts) — Up 38% Y/Y and up 8% Q/Q
| Q4'23 | Q1'24 | Q2'24 | Q3'24 | Q4'24 | Q1'25 | Q2'25 | Q3'25 | Q4'25 |
|---|---|---|---|---|---|---|---|---|
| 296 | 344 | 390 | 443 | 477 | 500 | 515 | 610 | 659 |
Crypto Notional Volumes¹ (In $ billions) — Up 16% Y/Y and up 3% Q/Q
| Q4'23 | Q1'24 | Q2'24 | Q3'24 | Q4'24 | Q1'25 | Q2'25 | Q3'25 | Q4'25 | |
|---|---|---|---|---|---|---|---|---|---|
| Robinhood App | 12.8 | 21.5 | 14.4 | 14.4 | 28.3 | 39.8 | 34.0 | 40.5 | 34.0 |
| Bitstamp | — | — | — | — | — | — | 6.7 | 40.5 | 48.4 |
| Total | 12.8 | 21.5 | 14.4 | 14.4 | 28.3 | 39.8 | 40.7 | 80.3 | 82.4 |
Including pre-close volumes, Bitstamp Notional Volumes would have been $24.0B and Crypto Notional Volumes would have been $52.3B in Q2'25¹
Refer to page 37 for details on volumes for newer trading products, including Index Options, Futures, and Event Contracts. (1) We acquired Bitstamp in June 2025. Bitstamp Crypto Notional Volumes in Q4 2025 were ~90% institutional and ~10% retail, with an average revenue rate of ~4 basis points per dollar of notional volume traded. Refer to Appendix for the definition of Notional Trading Volume, and to page 38 for a breakdown of Crypto Notional Volumes.
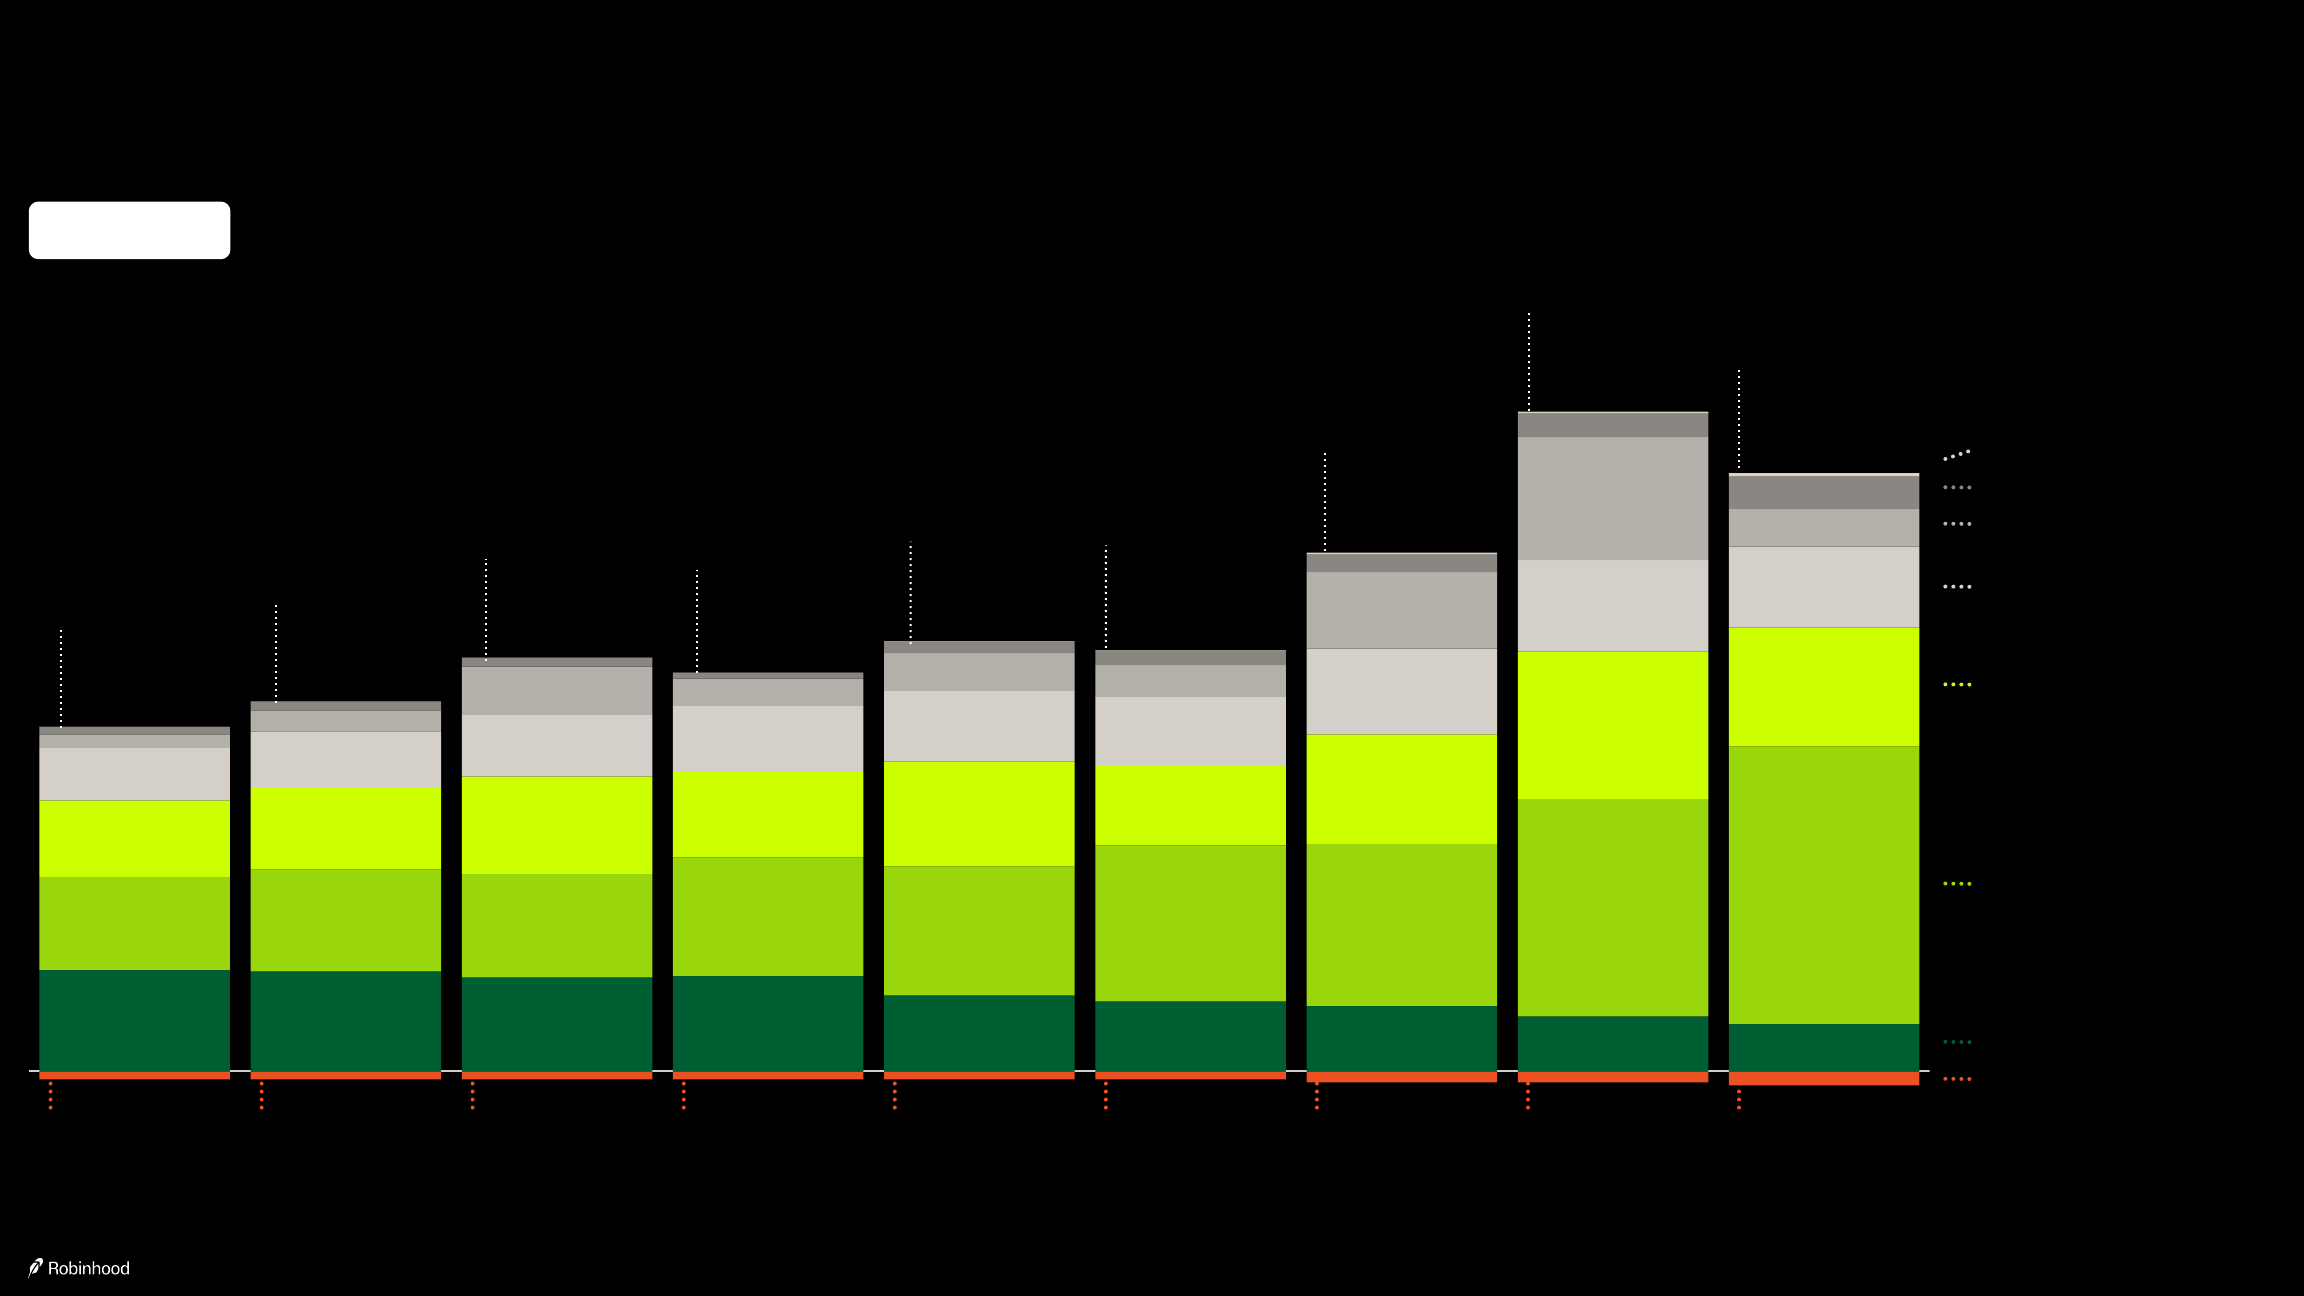
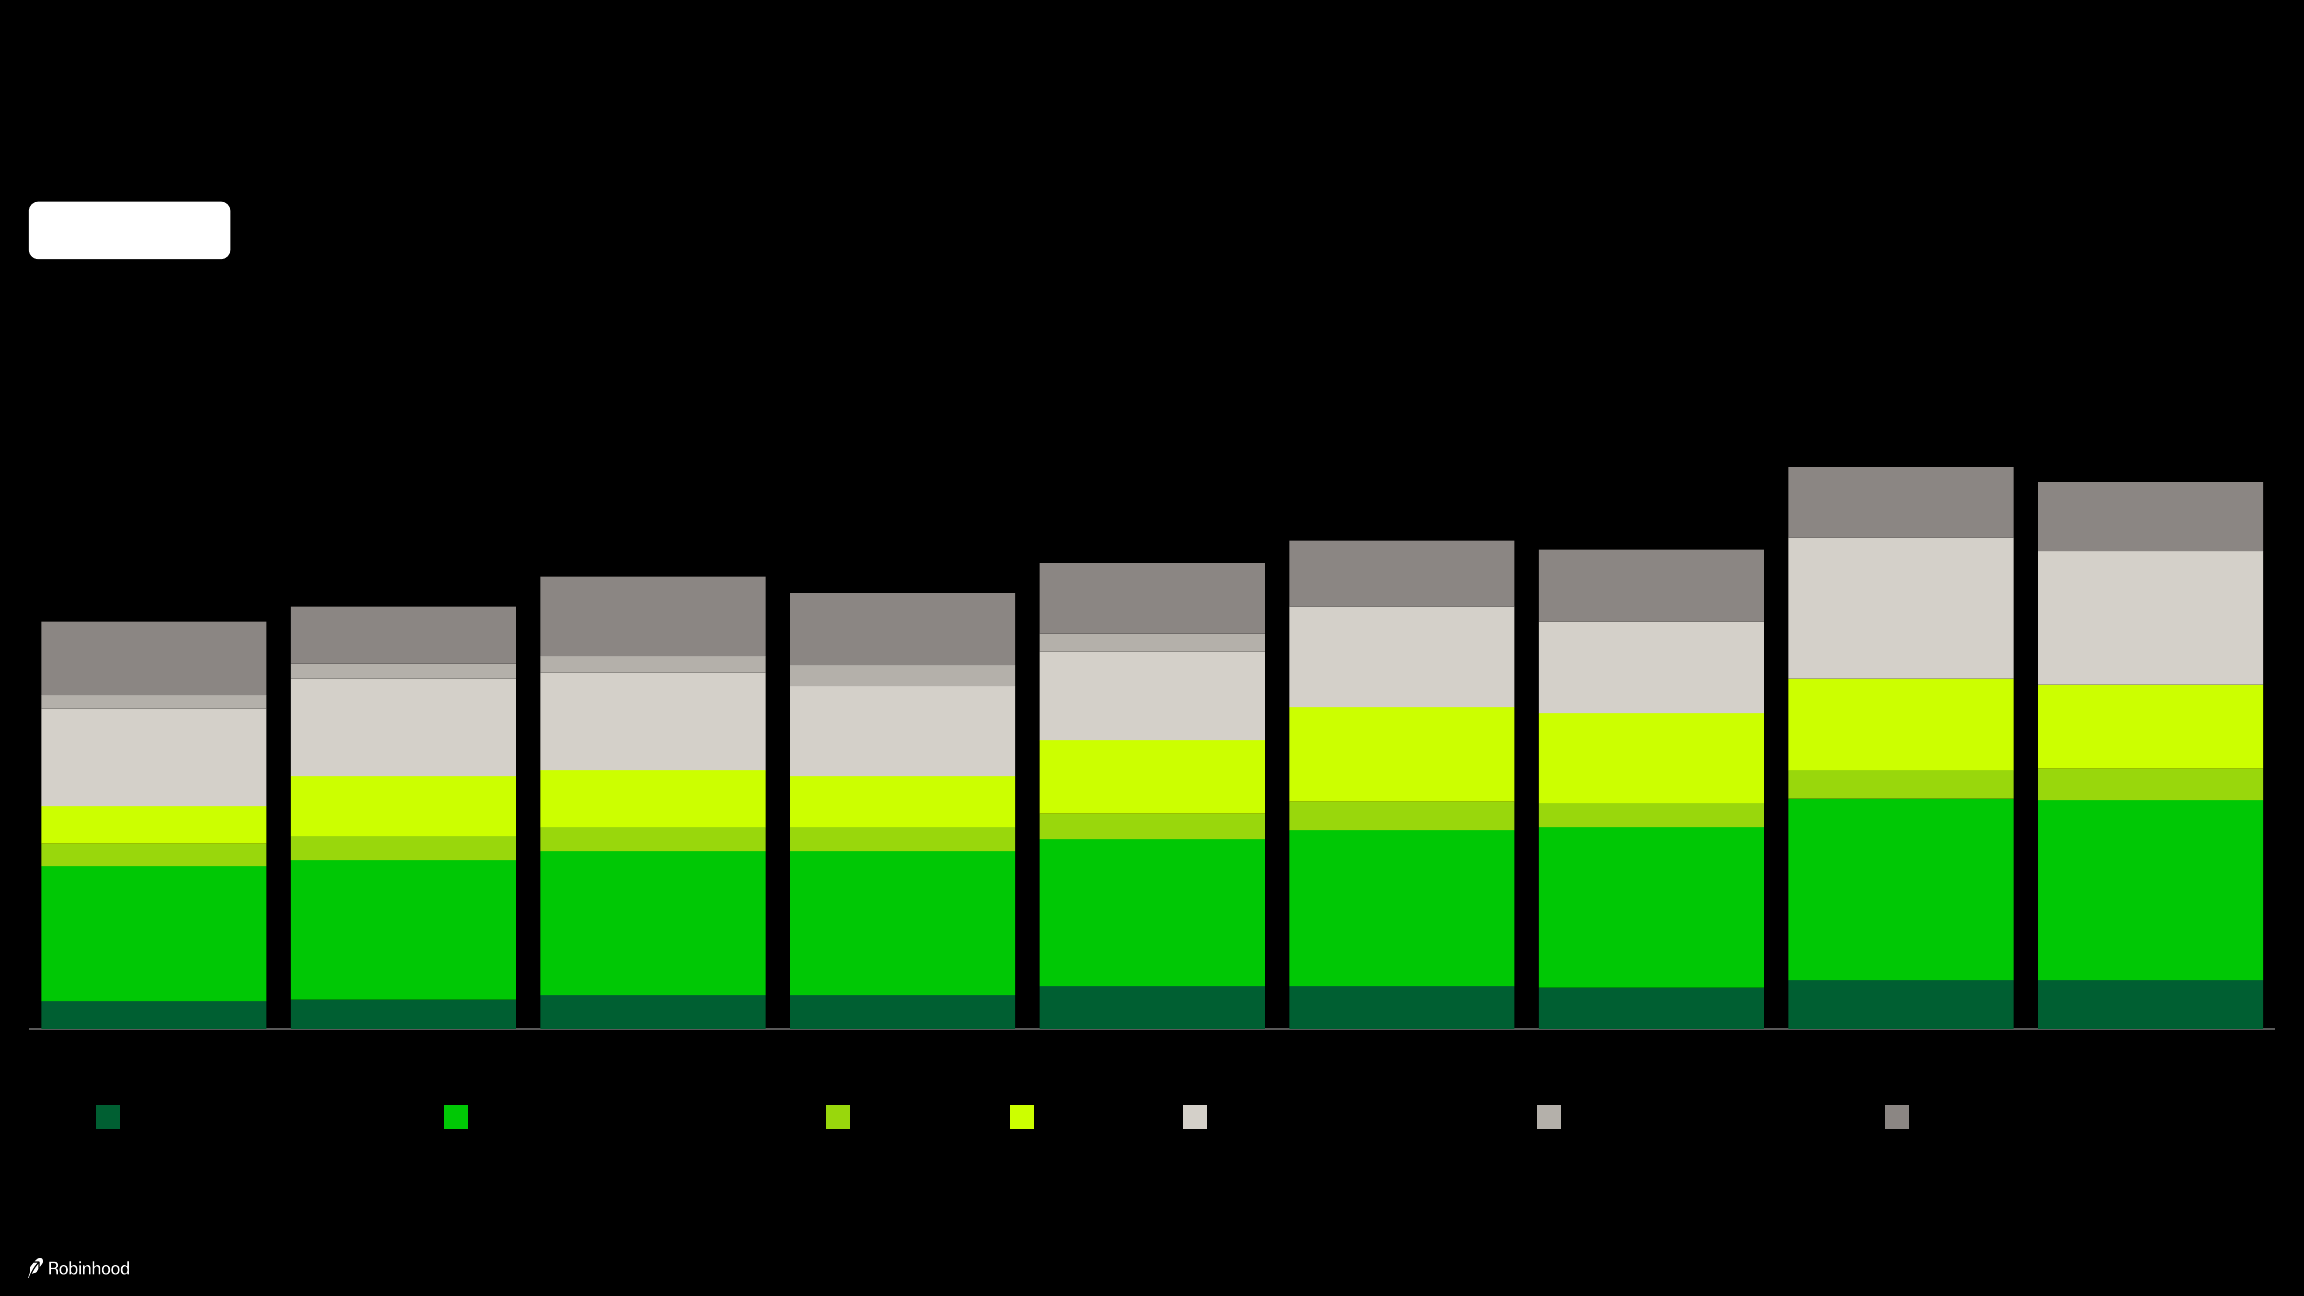
Total net revenues were up 27% year-over-year to a record $1.3 billion in Q4, and ARPU was $191
In millions, except for ARPU
Year-over-year change: +27% | Sequential change: +1%
| Q4'23 | Q1'24 | Q2'24 | Q3'24 | Q4'24 | Q1'25 | Q2'25 | Q3'25 | Q4'25 | Y/Y | Q/Q | |
|---|---|---|---|---|---|---|---|---|---|---|---|
| Transaction-based revenues | $200 | $329 | $327 | $319 | $672 | $583 | $539 | $730 | $776 | +15% | +6% |
| Net interest revenues | $236 | $254 | $285 | $274 | $296 | $290 | $357 | $456 | $411 | +39% | (10%) |
| Other revenues | $35 | $35 | $70 | $44 | $46 | $54 | $93 | $88 | $96 | +109% | +9% |
| Total Net Revenues | $471 | $618 | $682 |
| investors.robinhood.com | 20 |
|---|---|
| Transaction-based revenues were up 15% year-over-year to a record $776million in Q4 | |
| +3% | |
| (18%) | |
| +41% | |
| (38%) | |
| +6%+15% | |
| +374% | +104% |
| Sequential | |
| change | |
| Year-over- | |
| year change | |
| (1) Other transaction-based revenues primarily comprise revenues related to prediction markets, instant withdrawals, futures, and interchange revenues which are offset by rewards expense. Instant withdrawals annualized revenues (defined as revenue in a given quarter times four) were ~$150M in Q3'25 and ~$140M in Q4'25. Prediction markets annualized | |
| revenues were ~$115M in Q3'25 and ~$435M in Q4'25. | |
| In millions | |
| $25 | |
| $39 $40 | $37 |
| $61 | $56 |
| $66 | |
| $86 | $94 |
| $121 | |
| $154 | |
| $182 | |
| $202 | |
| $222 | $240 |
| $265 | |
| $304 | |
| $314 | |
| $43 | |
| $126 | |
| $81 | |
| $61 | |
| $358 | |
| $252 | |
| $160 | |
| $268 | |
| $221 | |
| $24 | |
| $19 | |
| $31 | |
| $35 | |
| $48 | |
| $72 | |
| $147 | |
| $200 | |
| $329 | $327 |
| $319 | |
| $672 | |
| $583 | |
| $539 | |
| $730 | |
| $776 | |
| Equity Options Crypto Other¹ | |
| Q4'23 Q1'24 Q2'24 Q3'24 Q4'24 Q1'25 Q2'25 Q3'25 | Q4'25 |
| $10 | |
| $11 | |
| +54% | +9% |
| Robinhood Earnings Presentation Q4 2025 |
| investors.robinhood.com | 21 | |
|---|---|---|
| $71 $70 | $66 $67 | |
| $53 | $49 | $46 |
| $39 | ||
| $33 | ||
| $66 | $72 | |
| $73 | ||
| $83 | ||
| $91 | ||
| $110 | $114 | |
| $153 | ||
| $196 | ||
| $54 | ||
| $58 | $68 | |
| $61 $74 | ||
| $56 | ||
| $77 | ||
| $103 | ||
| $83 | ||
| $37 | ||
| $39 | ||
| $44 | ||
| $46 | ||
| $50 | ||
| $48 | ||
| $60 | ||
| $64 | ||
| $57 | ||
| $9 | ||
| $15 | ||
| $34 | $19 | |
| $26 | ||
| $23 | ||
| $54 | ||
| $87 | ||
| $26 | ||
| $13 | ||
| $17 | ||
| $24 | ||
| $236 | ||
| $254 | ||
| $285 | ||
| $274 | ||
| $296 | ||
| $290 | ||
| $357 | ||
| $456 | ||
| $411 | ||
| Q4'23 Q1'24 Q2'24 Q3'24 Q4'24 Q1'25 Q2'25 Q3'25 | Q4'25 | |
| Net interest revenues were up 39% year-over-year to $411 million in Q4 | ||
| Refer to page 42 in the Appendix for additional details on net interest revenues. | ||
| In millions | ||
| $5 | ||
| Cash Sweep | ||
| Interest on segregated | ||
| cash, securities, and | ||
| deposits | ||
| Interest on corporate cash | ||
| and investments | ||
| Margin interest | ||
| Securities lending, net | ||
| Interest expense related to | ||
| credit facilities | ||
| Credit card, net | ||
| $6 | ||
| $6 | ||
| ($8)($6)($6) ($6) ($6) ($6) | ||
| $4 | ||
| $8 | ||
| Year-over-year change +39% | ||
| Sequential change (10%) | ||
| Robinhood Earnings Presentation Q4 2025 | ||
| $1 | ||
| ($8) | ||
| Other | ||
| ($6) | ||
| $1 | ||
| ($10) | ||
| $10 | ||
| $2 |
| investors.robinhood.com | 22 | |
|---|---|---|
| $31 $33 | $37 $37 | |
| $48 $48 | $45 | |
| $54 $54 | ||
| $147 | ||
| $152 | ||
| $157 $157 | ||
| $160 | ||
| $170 | $175 | |
| $197 | $196 | |
| $24 | ||
| $26 | ||
| $26 $26 | ||
| $27 | ||
| $30 $27 | ||
| $32 $35 | ||
| $41 | ||
| $65 | ||
| $63 | $56 | |
| $80 | ||
| $103 | ||
| $97 | ||
| $100 | $91 | |
| $107 | ||
| $106 | ||
| $106 | ||
| $98 | ||
| $97 | ||
| $109 | ||
| $100 | ||
| $152 | ||
| $145 | ||
| $14 | ||
| $16 | ||
| $18 | ||
| $23 | ||
| $19 | ||
| $81 | ||
| $62 | ||
| $86 | ||
| $79 | ||
| $77 | ||
| $73 | ||
| $78 | ||
| $78 | ||
| $76 | ||
| $445 | ||
| $460 | ||
| $493 | ||
| $476 | ||
| $508 | ||
| $533 | ||
| $522 | ||
| $613 | ||
| $597 | ||
| Brokerage and transaction Technology and development Operations Marketing General and administration Provision for credit losses¹ Share-based compensation | ||
| Q4'23 | Q1'24 Q2'24 Q3'24 Q4'24 Q1'25 | Q2'25 Q3'25 Q4'25 |
| Adjusted Operating Expenses and SBC increased 18% year-over-year to $597 million in Q4 | ||
| In millions | ||
| Adjusted Operating Expenses and SBC is a non-GAAP financial measure. Refer to the Appendix for the reconciliations of Adjusted Operating Expenses and SBC to the most directly comparable | ||
| GAAP measure, total operating expenses. Certain reclassifications have been made to prior year amounts to conform to the current year presentation. The impact of these reclassifications is | ||
| immaterial to the presentation of the financials taken as a whole. | ||
| (1) Starting in Q1 2025, Adjusted Operating Expenses and SBC no longer includes provision for credit losses. | ||
| Year-over-year change +18% | ||
| Sequential change (3%) | ||
| Robinhood Earnings Presentation Q4 2025 |
| investors.robinhood.com | 23 |
|---|---|
| $1.94 | |
| $2.27 | |
| 2024 2025 2026 Outlook | |
| 2024 provision for | |
| credit losses | |
| totaled $76M | |
| +22% | |
| 1 | |
| +18% at | |
| midpoint | |
| Adjusted Operating Expenses and SBC | |
| in billions | |
| ~5% | |
| ~3% | |
| ~10% | |
| +18% at midpoint | |
| 2026 Expense | |
| Growth Outlook | |
| • Investments into new or recently launched products, including: | |
| ◦ Robinhood Gold Card | |
| ◦ Robinhood Banking | |
| ◦ Prediction Markets | |
| ◦ Robinhood Cortex | |
| ◦ Robinhood Ventures | |
| ◦ Robinhood Social | |
| ◦ Tokenization, Robinhood Chain | |
| ◦ Launch in new markets | |
| • Other growth initiatives including marketing | |
| • Rapid growth in existing core products | |
| • Partially funded by productivity and efficiency gains in existing | |
| businesses | |
| We designed an investment plan to drive another year of profitable growth in 2026 | |
| (1) Prior to 2024 provision for credit losses, which totaled $76 million. | |
| Adjusted Operating Expenses and SBC is a non-GAAP financial measure. Refer to the Appendix for the reconciliation of Adjusted Operating Expenses and SBC to the most directly comparable GAAP measure, total operating expenses. Refer to the Appendix for additional information on our 2026 outlook. In 2024, Adjusted Operating Expenses and SBC included | |
| provision for credit losses, which totaled $76M. Starting in Q1 2025, Adjusted Operating Expenses and Adjusted Operating Expenses and SBC no longer include provision for credit losses. | |
| Robinhood Earnings Presentation Q4 2025 | |
| Our 2026 outlook does does not include provision for credit losses, costs related to our pending acquisitions, costs related to the Rothera joint venture, costs from equity | |
| modifications of executive awards related to our CFO transition, potential significant regulatory matters, or other significant expenses whose size or timing we are unable to | |
| accurately predict. | |
| $2.6 to $2.725 | |
| • Full-year costs from the 2025 acquisitions of TradePMR and | |
| Bitstamp |
| investors.robinhood.com | 24 |
|---|---|
| Diluted share count was roughly flat in 2025, and we anticipate diluted share count will be | |
| roughly flat in 2026 as well | |
| Basic and Diluted Share Count | |
| in millions | |
| (1) Q2'25 includes the impact of approximately 4M 2019 CEO Market-Based RSUs vesting. Q3'25 includes the impact of approximately 7M 2019 CEO Market-Based RSUs vesting. Refer to Appendix for definition of 2019 CEO Market-Based RSUs. | |
| (2) Under GAAP, for any period with net income, diluted EPS is calculated using the treasury method for diluted shares, which may cause differences compared to diluted shares shown in this schedule dependent on Robinhood's share price. | |
| Share-Based Compensation Expense | |
| in millions |
| 884 | 885 888 | 899 | 901 |
|---|---|---|---|
| 39 35 30 | 23 | 20 | |
| 923 | 920 | 918 | 922 921 |
Basic Share Count Dilutive Shares²
Q4'24 Q1'25 Q2'25¹ Q3'25¹ Q4'25
Year-over- year change (0.3%)
+1.9%
$77 $73 $78 $78 $76
| Q4'24 | Q1'25 Q2'25 Q3'25 Q4'25 |
|---|---|
| SBC as a % of Total Net Revenues | |
| 8% 8% 8% 6% 6% | |
| $305M (7% of total net revenues) over the last twelve months | |
| Robinhood Earnings Presentation Q4 2025 |
| investors.robinhood.com | 25 |
|---|---|
| $30 | |
| $157 | |
| $188 | |
| $150 | |
| $916 | |
| $336 | |
| $386 | |
| $556 | |
| $605 | |
| $492 | |
| $424 | |
| Q4'23 Q1'24 Q2'24 Q3'24 Q4'24 Q1'25 | Q2'25 Q3'25 Q4'25 |
| GAAP net income was $605million in Q4 and a record $1.9billion in 2025 | |
| In millions, except for EPS | |
| Q4 2024 Net Income Prior to Tax Benefit and Regulatory Accrual Reversal and Q4 2024 EPS Prior to Tax Benefit and Regulatory Accrual Reversal are non-GAAP financial | |
| measures. Refer to the Appendix for the reconciliation of Q4 2024 Net Income Prior to Tax Benefit and Regulatory Accrual Reversal and Q4 2024 EPS Prior to Tax Benefit and | |
| Regulatory Accrual Reversal to the most directly comparable GAAP measures, net income (loss) and diluted EPS, respectively. | |
| Diluted Earnings per Share (EPS) | |
| $0.03 $0.18 $0.21 $0.17 $1.01 $0.37 $0.42 $0.61 $0.66 | |
| Year-over-year change ($311) | |
| Sequential change +$49 | |
| Q4 2024 Net Income Prior to | |
| Tax Benefit and Regulatory | |
| Accrual Reversal | |
| Q4 2024 Tax Benefit and | |
| Regulatory Accrual Reversal | |
| Q4 2024 EPS Prior to Tax | |
| Benefit and Regulatory Accrual | |
| Reversal was $0.54 | |
| Robinhood Earnings Presentation Q4 2025 | |
| $1.9B or $2.05 of Diluted EPS in 2025 |
| investors.robinhood.com | 26 | |
|---|---|---|
| $133 | ||
| $247 | ||
| $301 | ||
| $268 | ||
| $613 | ||
| $470 | ||
| $549 | ||
| $742 | ||
| $761 | ||
| Q4'23 | Q1'24 Q2'24 Q3'24 Q4'24 Q1'25 Q2'25 | Q3'25 Q4'25 |
| Adjusted EBITDA increased 24% year-over-year to a record $761 million in Q4 and grew | ||
| to a record $2.5billion in 2025 | ||
| Adjusted EBITDA and Adjusted EBITDA Margin are non-GAAP financial measures. Refer to the Appendix for the reconciliations of Adjusted EBITDA and Adjusted EBITDA Margin to the most | ||
| directly comparable GAAP measures, net income and net margin. | ||
| Year-over-year change +$148 | ||
| Sequential change +$19 | ||
| In millions | ||
| Adjusted | ||
| EBITDA | ||
| Margin | ||
| 59%56%51%60%42%44%40%28% 58% | ||
| Robinhood Earnings Presentation Q4 2025 | ||
| $2.5B (56% margin) in 2025 |
| investors.robinhood.com | 27 | |
|---|---|---|
| Rule of 40 | ||
| 1 | ||
| results demonstrate the power of our business model | ||
| (1) Defined as year-over-year change in total net revenues plus Adjusted EBITDA Margin in a given period. | ||
| Adjusted EBITDA Margin is a non-GAAP financial measure. Refer to the Appendix for the reconciliations of Adjusted EBITDA Margin to the most directly comparable GAAP measure, net margin. | ||
| 58% | 60% | 59% |
| 75% | ||
| 52% | ||
| 48% | ||
| 51% | ||
| 53% | ||
| 56% | ||
| 56% | ||
| 106% | ||
| 111% | 112% | |
| 131% | ||
| 108% | ||
| Y/Y Change in Total Net Revenues Adjusted EBITDA Margin Rule of 40¹ | ||
| Q4'24 LTM Q1'25 LTM Q2'25 LTM Q3'25 LTM Q4'25 LTM | ||
| 40% | ||
| Robinhood Earnings Presentation Q4 2025 |
| investors.robinhood.com | 28 |
|---|---|
| With over $4B in corporate cash, investments, and stablecoin | |
| 1 | |
| , we are well positioned to | |
| continue deploying capital | |
| In billions | |
| • Our balance sheet remains strong with $4.6 | |
| billion of corporate cash, investments, and | |
| stablecoin | |
| 1 | |
| today, as well as $3.8billion in | |
| available lines of credit. | |
| • We believe the strength of our balance sheet | |
| gives us the flexibility to run our business | |
| while investing for future growth. | |
| • We will continue to look to drive growth and | |
| shareholder value by allocating capital across: | |
| • Organic growth | |
| • M&A | |
| • Shareholder returns | |
| $5.3 $5.3 | |
| $5.1 $5.1 $5.1 | |
| $4.6 | |
| $4.3 | |
| $4.4 | |
| $4.6 | |
| Q4'23 Q1'24 Q2'24 Q3'24 Q4'24 Q1'25 Q2'25 Q3'25 Q4'25 | |
| Year-over-year change ($0.5) | |
| Sequential change +$0.2 | |
| (1) Includes cash and cash equivalents, investments, and stablecoin. For more information on our investments and stablecoin, see Note - Investments and Fair Value Measurement to our | |
| consolidated financial statements in our Q3 2025 10-Q, and, once filed, our 2025 10-K. | |
| Robinhood Earnings Presentation Q4 2025 |
| investors.robinhood.com | 29 | |
|---|---|---|
| $160 | ||
| $322 | ||
| $124 | ||
| $107 | ||
| $100 | ||
| Q4'24 | Q1'25 | Q2'25 Q3'25 Q4'25 |
| In Q4, we returned $100 million to shareholders by repurchasing 0.8million of our shares | ||
| 1 | ||
| , and since | ||
| starting our repurchase program, have returned ~$910 million by repurchasing ~22 million shares | ||
| Share Repurchases | ||
| In millions | ||
| (1) Shares of our Class A common stock. | ||
| ~$910M | ||
| ~$590M | ||
| $1.5B Share Repurchase Program | ||
| Diluted Shares (In millions) | ||
| 923 920 918 922 921 | ||
| Robinhood Earnings Presentation Q4 2025 | ||
| Deployed | ||
| As of 12/31/2025 | ||
| Remaining | ||
| Includes ~2 million shares | ||
| repurchased to offset shares | ||
| issued in connection with | ||
| the acquisition of TradePMR | ||
| • In Q3 2024, we began returning capital to | ||
| shareholders under our $1 billion share | ||
| repurchase program, which was increased | ||
| to $1.5 billion in April 2025. | ||
| • So far, we have repurchased ~22 million of | ||
| our shares for $910 million at an average | ||
| price per share of ~$41, including 0.8 | ||
| million shares for $100 million in Q4 2025 | ||
| at an average price per share of ~$120. | ||
| • We have ~$590 million left to deploy, and | ||
| we continue to repurchase shares in Q1, | ||
| with flexibility to accelerate if market | ||
| conditions warrant. |

30
Appendix

| investors.robinhood.com | 31 |
|---|---|
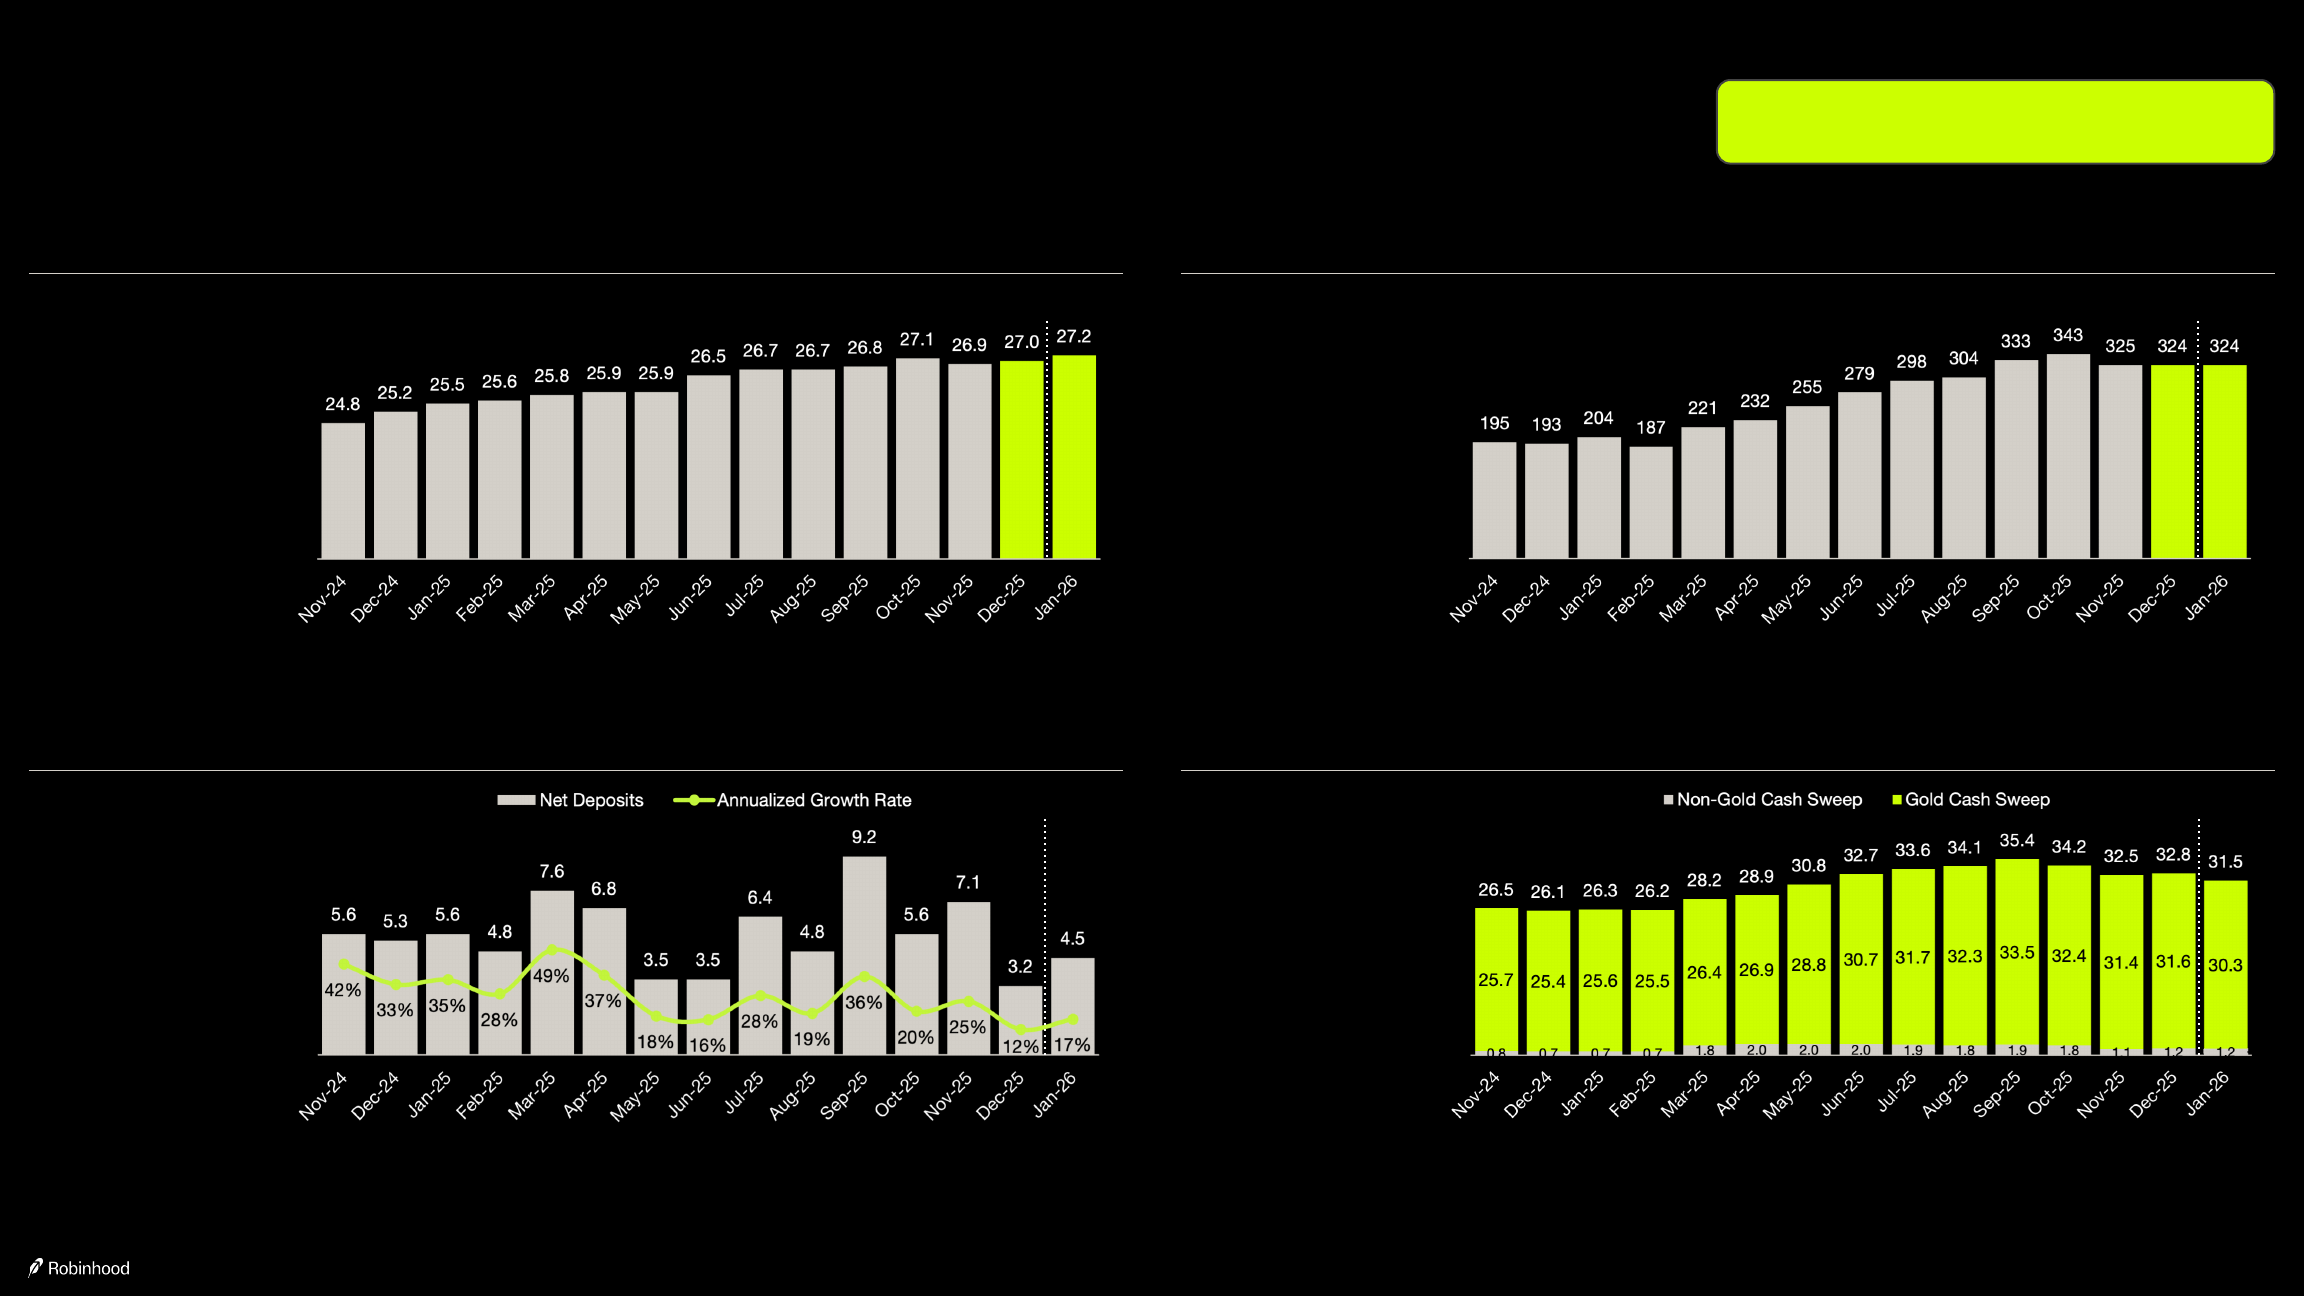
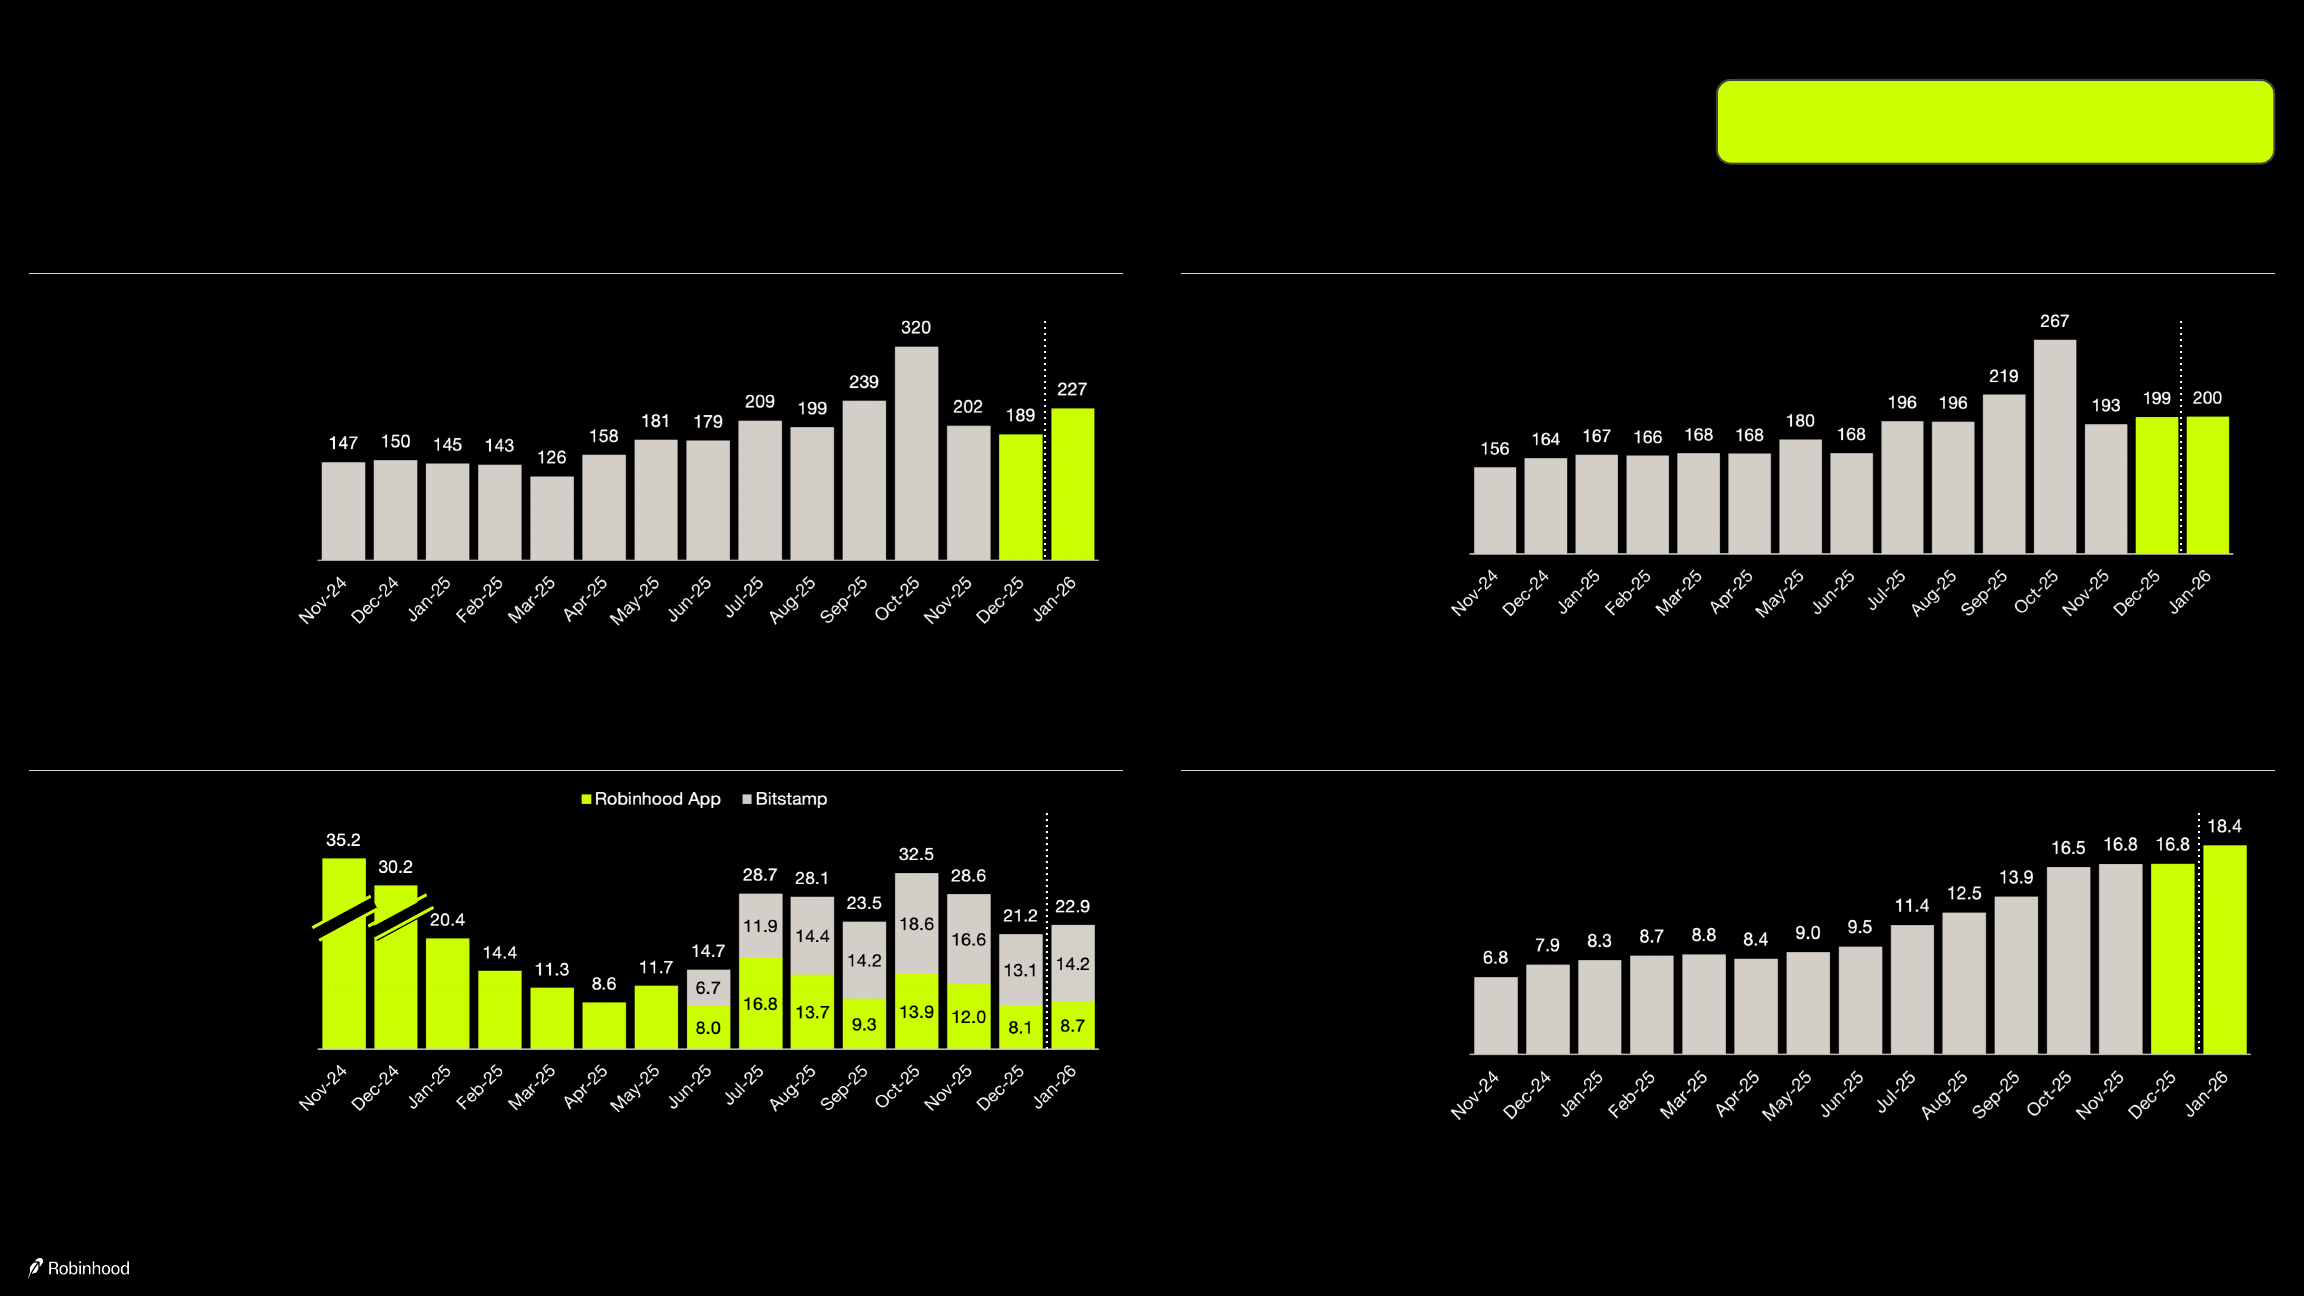
| December 2025 Monthly Metrics | |
| See the Appendix for definitions. Monthly percentage change represents the most recent calendar month as compared to the immediately preceding calendar month. Yearly percentage change represents the most recent calendar month as compared to the same month of the prior year. | |
| (1) Starting in June 2025, Net Deposits include results from Bitstamp. Net Deposits do not include results from TradePMR. | |
| (2) Refer to Appendix for the definition of Notional Trading Volume. | |
| (3) Crypto DARTs do not include Bitstamp Institutional activity. | |
| (4) Starting in December 2025, includes Robinhood Banking balances, which totaled $0.1B as of 12/31/2025 and $0.3B as of 1/31/2026. | |
| 2024 2025 Change 2026 | |
| Nov Dec Jan Feb Mar Apr May Jun Jul Aug Sep Oct Nov Dec M/M Y/Y Jan | |
| Funded Customer Growth (M) | |
| Funded Customers 24.8 25.2 25.5 25.6 25.8 25.9 25.9 26.5 26.7 26.7 26.8 27.1 26.9 27.0 - 7% 27.2 | |
| Asset Growth ($B) | |
| Total Platform Assets $194.6 $192.9 $203.7 $187.4 $220.6 $232.3 $255.3 $278.6 $298.0 $303.9 $332.7 $342.6 $324.5 $324.0 - 68% $324.3 | |
| Net Deposits | |
| 1 | |
| $5.6 $5.3 $5.6 $4.8 $7.6 $6.8 $3.5 $3.5 $6.4 $4.8 $9.2 $5.6 $7.1 $3.2 NM NM $4.5 | |
| Trading | |
| Trading Days (Equities and Options) 20 21 20 19 21 21 21 20 22 21 21 23 19 22 16% 5% 20 | |
| Total Trading Volumes | |
| Equity ($B) $147.1 $149.8 $144.7 $142.9 $125.6 $157.8 $180.5 $179.1 $209.1 $199.2 $238.8 $320.1 $201.5 $188.6 (6%) 26% $227.3 | |
| Options Contracts (M) 155.5 163.7 166.6 165.6 167.9 167.5 179.8 168.1 195.8 195.5 218.8 266.7 193.2 199.4 3% 22% 200.0 | |
| Crypto ($B) | |
| 2 | |
| $35.2 $30.2 $20.4 $14.4 $11.3 $8.6 $11.7 $14.7 $28.7 $28.1 $23.5 $32.5 $28.6 $21.2 (26%) (30%) $22.9 | |
| Robinhood App ($B) $35.2 $30.2 $20.4 $14.4 $11.3 $8.6 $11.7 $8.0 $16.8 $13.7 $9.3 $13.9 $12.0 $8.1 (33%) (73%) $8.7 | |
| Bitstamp ($B) - - - - - - - $6.7 $11.9 $14.4 $14.2 $18.6 $16.6 $13.1 (21%) NA $14.2 | |
| Event Contracts (B) 0.5 - - - 0.3 0.2 0.3 0.4 0.3 0.3 1.7 2.5 3.0 2.9 (3%) NA 3.4 | |
| Daily Average Revenue Trades (DARTs) (M) | |
| Equity 2.5 2.8 2.6 2.4 2.3 2.3 2.3 2.6 2.7 2.5 3.0 3.1 2.7 2.7 - (4%) 2.8 | |
| Options 1.0 1.0 1.1 1.2 1.1 1.2 1.2 1.1 1.1 1.2 1.3 1.4 1.3 1.1 (15%) 10% 1.3 | |
| Crypto | |
| 3 | |
| 1.0 1.0 0.9 0.7 0.6 0.5 0.5 0.5 0.7 0.6 0.5 0.6 0.6 0.5 (17%) (50%) 0.5 | |
| Customer Margin and Cash Sweep ($B) | |
| Margin Book $6.8 $7.9 $8.3 $8.7 $8.8 $8.4 $9.0 $9.5 $11.4 $12.5 $13.9 $16.5 $16.8 $16.8 - 113% $18.4 | |
| Total Cash Sweep $26.5 $26.1 $26.3 $26.2 $28.2 $28.9 $30.8 $32.7 $33.6 $34.1 $35.4 $34.2 $32.5 $32.8 1% 26% $31.5 | |
| Gold Cash Sweep | |
| 4 | |
| $25.7 $25.4 $25.6 $25.5 $26.4 $26.9 $28.8 $30.7 $31.7 $32.3 $33.5 $32.4 $31.4 $31.6 1% 24% $30.3 | |
| Non-Gold Cash Sweep $0.8 $0.7 $0.7 $0.7 $1.8 $2.0 $2.0 $2.0 $1.9 $1.8 $1.9 $1.8 $1.1 $1.2 9% 71% $1.2 | |
| Total Securities Lending Revenue ($M) $23 $28 $25 $22 $24 $25 $33 $54 $61 $53 $59 $60 $34 $38 12% 36% $35 | |
| Robinhood Earnings Presentation Q4 2025 | |
| We have included preliminary January 2026 metrics to provide | |
| insight into our most recent business activity. We will provide our | |
| January 2026 Monthly Metrics release in the coming weeks. |
| investors.robinhood.com | 32 |
|---|---|
| December 2025 Monthly Metrics Dashboard | |
| Robinhood Earnings Presentation Q4 2025 | |
| Totals may not foot due to rounding. | |
| (1) Starting in June 2025, Net Deposits include results from Bitstamp. Net Deposits do not include results from TradePMR. | |
| (2) Starting in December 2025, includes Robinhood Banking balances, which totaled $0.1B as of 12/31/2025 and $0.3B as of 1/31/2026. | |
| Funded Customers | |
| In millions | |
| Total Platform Assets | |
| In $ billions | |
| Net Deposits | |
| 1 | |
| In $ billions | |
| Cash Sweep | |
| 2 | |
| In $ billions | |
| Dec-25 | |
| 27.0M | |
| +100k M/M | |
| +1.87M Y/Y | |
| Dec-25 | |
| $324B | |
| - M/M | |
| +68% Y/Y | |
| Dec-25 | |
| $3.2B | |
| 12% Annualized Growth | |
| $68.1B LTM | |
| 35% LTM Growth | |
| Dec-25 | |
| $32.8B | |
| +1% M/M | |
| +26% Y/Y | |
| We have included preliminary January 2026 metrics to provide | |
| insight into our most recent business activity. We will provide our | |
| January 2026 Monthly Metrics release in the coming weeks. |
| investors.robinhood.com | 33 |
|---|---|
| December 2025 Monthly Metrics Dashboard (Continued) | |
| Robinhood Earnings Presentation Q4 2025 | |
| (1) Refer to Appendix for the definition of Notional Trading Volume. | |
| Equity Notional Volumes | |
| In $ billions | |
| Options Contracts Traded | |
| In millions | |
| Crypto Notional Volumes | |
| 1 | |
| In $ billions | |
| Margin Book | |
| In $ billions | |
| Dec-25 | |
| $189B | |
| (6%) M/M | |
| +26% Y/Y | |
| Dec-25 | |
| 199M | |
| +3% M/M | |
| +22% Y/Y | |
| Dec-25 | |
| $21.2B | |
| (26%) M/M | |
| (30%) Y/Y | |
| Dec-25 | |
| $16.8B | |
| - M/M | |
| +113% Y/Y | |
| We have included preliminary January 2026 metrics to provide | |
| insight into our most recent business activity. We will provide our | |
| January 2026 Monthly Metrics release in the coming weeks. |

| investors.robinhood.com | 34 |
|---|---|
| Changes in Funded Customers and Total Platform Assets | |
| Q4'23 Q1'24 Q2'24 Q3'24 Q4'24 Q1'25 Q2'25 Q3'25 Q4'25 | |
| Beginning Funded Customers 23.3 23.4 23.9 24.2 24.3 25.2 25.8 26.5 26.8 | |
| New Customers 0.3 0.5 0.5 0.4 0.8 0.7 0.6 0.7 0.6 | |
| Resurrected Customers 0.1 0.2 0.1 0.1 0.3 0.2 0.1 0.1 0.2 | |
| Acquired customers — — — — — 0.1 0.5 — — | |
| Churned Customers (0.3) (0.2) (0.3) (0.4) (0.2) (0.4) (0.5) (0.5) (0.6) | |
| Ending Funded Customers 23.4 23.9 24.2 24.3 25.2 25.8 26.5 26.8 27.0 | |
| Q4'23 Q1'24 Q2'24 Q3'24 Q4'24 Q1'25 Q2'25 Q3'25 Q4'25 | |
| Beginning balance $86.5 $102.6 $129.6 $139.7 $152.2 $192.9 $220.6 $278.6 $332.7 | |
| Acquired assets — — — — — 42.9 8.9 — — | |
| Net Deposits 4.6 11.2 13.2 10.0 16.1 18.0 13.8 20.4 15.9 | |
| Net market gains (losses) 11.5 15.8 (3.1) 2.5 24.6 (33.2) 35.3 33.7 (24.6) | |
| Ending balance $102.6 $129.6 $139.7 $152.2 $192.9 $220.6 $278.6 $332.7 $324.0 | |
| Funded Customers | |
| In millions | |
| Total Platform Assets | |
| In billions | |
| Robinhood Earnings Presentation Q4 2025 |
| investors.robinhood.com | 35 |
|---|---|
| Net Cash Held by Users Reconciliation | |
| In billions | |
| Q4'23 Q1'24 Q2'24 Q3'24 Q4'24 Q1'25 Q2'25 Q3'25 Q4'25 | |
| Gold Cash Sweep | |
| 1 | |
| $15.7 $18.2 $20.3 $23.9 $25.4 $26.4 $30.7 $33.5 $31.6 | |
| Non-Gold Cash Sweep (excluding TradePMR) 0.7 0.8 0.6 0.6 0.7 0.6 0.8 0.8 — | |
| Total Cash Sweep (excluding TradePMR) $16.4 $19.0 $20.9 $24.5 $26.1 $27.0 $31.5 $34.3 $31.6 | |
| Free Credit Balances and Other 4.9 5.8 5.7 6.1 7.2 7.0 10.3 12.0 11.8 | |
| Total cash held by users $21.3 $24.8 $26.6 $30.6 $33.3 $34.0 $41.8 $46.3 $43.4 | |
| Receivables from Users (3.4) (4.1) (5.0) (5.5) (8.0) (8.8) (9.3) (13.8) (16.8) | |
| Net cash held by users $17.9 $20.7 $21.6 $25.1 $25.3 $25.2 $32.5 $32.5 $26.6 | |
| Robinhood Earnings Presentation Q4 2025 | |
| (1) Starting in December 2025, includes Robinhood Banking balances, which totaled $0.1B as of 12/31/2025. |

| investors.robinhood.com | 36 |
|---|---|
| Customers placing trades | |
| +6% Y/Y | |
| 0% Q/Q | |
| Avg. notional volume per trader | |
| +50% Y/Y | |
| +8% Q/Q | |
| Customers placing trades | |
| +12% Y/Y | |
| 0% Q/Q | |
| Contracts per trader | |
| +19% Y/Y | |
| +9% Q/Q | |
| Customers placing trades | |
| (31%) Y/Y | |
| (6%) Q/Q | |
| Avg. notional volume per trader | |
| (31%) Y/Y | |
| (9%) Q/Q | |
| Trading Volumes for Q4 2025 | |
| Equity Notional Volumes | Options Contracts Traded Robinhood App |
| Crypto Notional Volumes | |
| 1 | |
| Up 68% Y/Y and up 10% Q/Q | |
| Driven by: | |
| Up 38% Y/Y and up 8% Q/Q | |
| Driven by: | |
| Down 52% Y/Y and down 15% Q/Q | |
| Driven by: | |
| Robinhood Earnings Presentation Q4 2025 | |
| (1) Refer to Appendix for the definition of Notional Trading Volume. | |
| Customers placing trades | |
| (17%) Q/Q | |
| Avg. notional volume per trader | |
| +45% Q/Q | |
| Bitstamp | |
| Crypto Notional Volumes | |
| 1 | |
| Up 20% Q/Q | |
| Driven by: |
| investors.robinhood.com | 37 |
|---|---|
| 0.3 | |
| 1.0 | |
| 2.3 | |
| 8.5 | |
| Q1'25 | Q2'25 Q3'25 Q4'25 |
| 3.4 | |
| 11.1 | |
| 9.1 | |
| 16.7 | |
| Q1'25 | Q2'25 Q3'25 Q4'25 |
| 10.4 | |
| 16.9 | |
| 24.8 | |
| 29.3 | |
| Q1'25 | Q2'25 Q3'25 Q4'25 |
| New trading products continue to scale, as Index Options, Futures, and Event Contracts | |
| reached new quarterly records in Q4 | |
| Index Options Contracts Traded | |
| 1 | |
| In millions of contracts | |
| Futures Contracts Traded | |
| In millions of contracts | |
| Event Contracts Traded | |
| In billions of contracts | |
| Up 18% Q/Q Up 84% Q/Q Up >3x Q/Q | |
| Robinhood Earnings Presentation Q4 2025 | |
| (1) Index Options Contracts Traded are included in Options Contracts Traded. Refer to Appendix for the definition of Options Contracts Traded. |

| investors.robinhood.com | 38 |
|---|---|
| Crypto Notional Trading Volumes | |
| 1 | |
| Q3'25 Q4'25 | |
| Sequential | |
| change | |
| Crypto Notional Trading Volumes ($B) | |
| Robinhood App 39.8 34.0 (15%) | |
| Bitstamp 40.5 48.4 +20% | |
| Retail 4.9 4.6 (6%) | |
| Institutional 35.6 43.8 +23% | |
| Crypto Notional Trading Volumes 80.3 82.4 +3% | |
| Crypto Transaction-Based Revenues ($M) | |
| Robinhood App 252 204 (19%) | |
| Bitstamp 16 17 +6% | |
| Crypto Transaction-Based Revenues 268 221 (18%) | |
| Robinhood Earnings Presentation Q4 2025 | |
| (1) Refer to Appendix for the definition of Notional Trading Volume. |
| investors.robinhood.com | 39 |
|---|---|
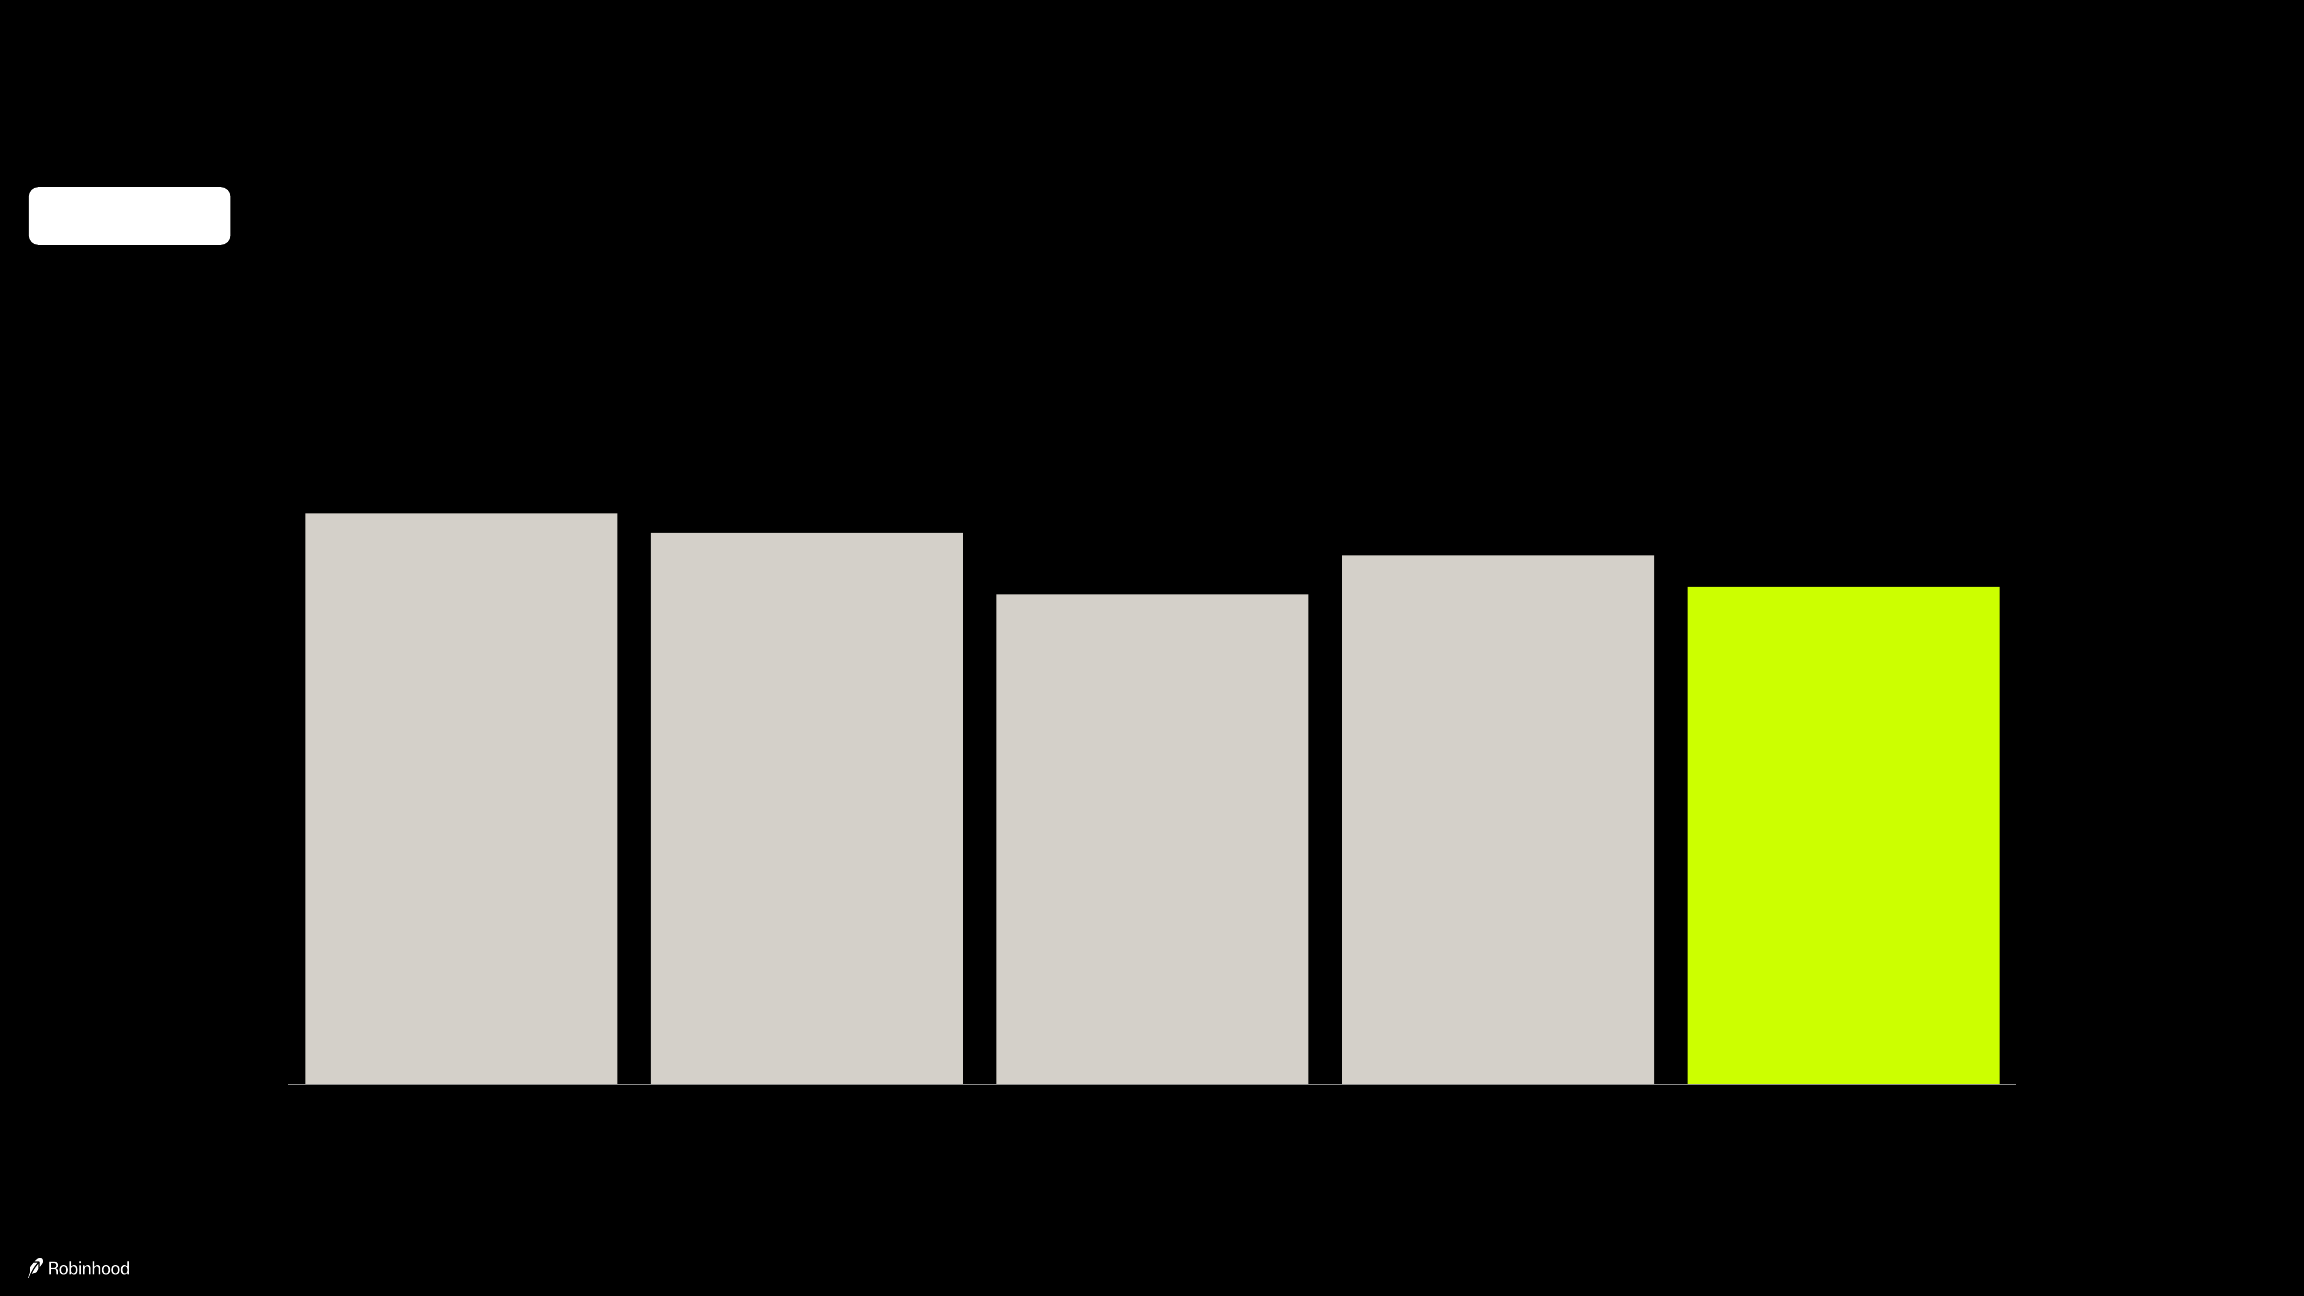
| Monthly Active Users (MAU) decreased by 1.9 million year-over-year to 13.0 million in Q4 | |
| Year-over-year change (1.9) | |
| Sequential change (0.8) | |
| In millions | |
| 14.9 | |
| 14.4 | |
| 12.8 | |
| 13.8 | |
| 13.0 | |
| Q4'24 Q1'25 Q2'25 Q3'25 Q4'25 | |
| Robinhood Earnings Presentation Q4 2025 |

| investors.robinhood.com | 40 |
|---|---|
| Annualized revenue per employee was $1.7 million in Q4, down 2% year-over-year | |
| Q4'24 Q1'25 Q2'25 Q3'25 Q4'25 | |
| Year-over-year | |
| change | |
| Sequential | |
| change | |
| End of period Employee Count | |
| 1 | |
| 2,298 2,492 2,827 2,972 2,944 +28% (1%) | |
| Total Net Revenues (in millions) $1,014 $927 $989 $1,274 $1,283 +27% +1% | |
| Average Employee Count 2,293 2,395 2,660 2,900 2,958 +29% +2% | |
| Annualized revenue per employee (in thousands) | |
| 2 | |
| $1,769 $1,548 $1,487 $1,758 $1,735 (2%) (1%) | |
| (1) Q1 2025 reflected the addition of ~150 employees as a result of the acquisition of TradePMR, and Q2 2025 reflected the addition of ~350 employees as a result of the acquisition of Bitstamp. | |
| (2) Annualized revenue per employee is calculated by multiplying total net revenues by four and dividing by average employee count for a given quarter. | |
| Robinhood Earnings Presentation Q4 2025 |

| investors.robinhood.com | 41 |
|---|---|
| In Q4 2025, we recorded $55 million of contra revenues associated with matches on | |
| customer transfers and deposits and allocated them on a proportional basis | |
| Customer Match Contra Revenue Allocation | |
| in millions | |
| Customer Match Amortization Detail | |
| Q1'25 Q2'25 Q3'25 Q4'25 | |
| Transaction-based revenues | |
| Options ($22) ($26) ($24) ($26) | |
| Equities (5) (6) (6) (7) | |
| Cryptocurrencies (12) (8) (9) (8) | |
| Other (2) (2) (3) (7) | |
| Net interest revenues | |
| Cash Sweep (2) (3) (3) (3) | |
| Other revenues (3) (3) (4) (4) | |
| Total contra revenue ($46) ($48) ($49) ($55) | |
| Customer Transfer and Contribution Matches | |
| • The customer match program started in 2023, first with matches on IRA | |
| contributions in Q1 2023 and then with matches on asset transfers from other | |
| brokerages in Q4 2023. | |
| • Since the start of the program through Q4 2025, we’ve provided customers with | |
| ~$820M of matches on ~$46B of asset transfers and contributions. This includes | |
| an additional $130M of matches in Q4 2025 on ~$9B of asset transfers and | |
| contributions (and customers also returned $10M of matches in Q4). | |
| • In Q4 2025, we amortized $41M of matches. At the end of Q4 2025, we had | |
| ~$580M of unamortized matches remaining with a weighted average amortization | |
| of approximately 4 years. | |
| Gold Deposit Boosts | |
| • The Gold deposit boost program started in June 2024, and we wound down the | |
| program in November of 2024. | |
| • Since the start of the program, we have paid out $102M of Gold deposit boosts, | |
| including $14M in Q4. | |
| • The majority of the remaining Gold deposit boosts earned by customers prior to | |
| the end of the program will be paid out over a period of 10 months. | |
| Robinhood Earnings Presentation Q4 2025 |

| investors.robinhood.com | 42 |
|---|---|
| Net interest revenues were $411million in Q4, up 39% year-over-year | |
| In millions | |
| Q4'23 Q1'24 Q2'24 Q3'24 Q4'24 Q1'25 Q2'25 Q3'25 Q4'25 | |
| Year-over- | |
| year change | |
| Sequential | |
| change | |
| Interest on corporate cash and investments | |
| 1 | |
| $71 $70 $66 $67 $53 $49 $46 $39 $33 (38%) (15%) | |
| Margin interest | |
| 2 | |
| 66 72 73 83 91 110 114 153 196 +115% +28% | |
| Interest on segregated cash and securities, and deposits | |
| 3 | |
| 54 58 68 61 74 56 77 103 83 +12% (19%) | |
| Cash sweep | |
| 4 | |
| 37 39 44 46 50 48 60 64 57 +14% (11%) | |
| Securities lending, net | |
| 5 | |
| 9 15 34 19 26 23 54 87 26 —% (70%) | |
| Credit card, net | |
| 6 | |
| 5 6 6 4 8 10 13 17 24 +200% +41% | |
| Interest expenses related to credit facilities | |
| 7 | |
| (6) (6) (6) (6) (6) (6) (8) (8) (10) +67% +25% | |
| Other — — — — — — 1 1 2 NM +100% | |
| Total net interest revenues $236 $254 $285 $274 $296 $290 $357 $456 $411 +39% (10%) | |
| The following summarizes each revenue line item presented above and, where applicable, the types of assets generating the revenue. | |
| (1) Interest on corporate cash and investments - Interest earned on corporate cash and cash equivalents and investments. | |
| (2) Margin interest - Interest paid by customers on margin balances. | |
| (3) Interest on segregated cash and securities, and deposits - Interest earned on cash and securities segregated under federal and other regulations, which includes cash collateral for Margin | |
| Securities Lending program, and deposits with clearing organizations. | |
| (4) Cash sweep - Interest earned on off-balance sheet Cash Sweep balances. | |
| (5) Securities lending, net - Revenue from the Margin Securities Lending program and the Fully-Paid Securities Lending program (net of Fully-Paid Securities Lending revenue shared with | |
| participating customers). | |
| (6) Credit card, net - Primarily comprise interest earned on customer credit card loan balances net of interest paid to financing partners. | |
| (7) Interest expenses related to credit facilities - Interest payments related to Robinhood’s credit facilities. | |
| Robinhood Earnings Presentation Q4 2025 |

| investors.robinhood.com | 43 |
|---|---|
| Margin Book | |
| Cash and | |
| deposits | |
| (1) | |
| Cash Sweep | |
| (off-balance | |
| sheet) | |
| Credit card, net | |
| (2) | |
| Total interest- | |
| earning assets | |
| Securities | |
| lending, net | |
| Interest expenses | |
| related to credit | |
| facilities | |
| (5) | |
| Other | |
| Total net interest | |
| revenues | |
| December 31, 2025 $16,823 $10,995 $32,786 $1,040 $61,644 | |
| September 30, 2025 $13,938 $14,352 $35,370 $742 $64,402 | |
| Average | |
| (3) | |
| $16,027 $13,048 $33,721 $901 $63,697 | |
| Q4 2025 Revenue (Expense) $196 $116 $57 $24 $393 $26 ($10) $2 $411 | |
| Q4 2025 Annualized Yield | |
| (4) | |
| 4.89% 3.56% 0.68% 10.65% 2.48% 2.58% | |
| September 30, 2025 $13,938 $14,352 $35,370 $742 $64,402 | |
| June 30, 2025 $9,457 $14,045 $32,719 $562 $56,783 | |
| Average | |
| (3) | |
| $11,812 $14,340 $33,947 $667 $60,766 | |
| Q3 2025 Revenue (Expense) $153 $142 $64 $17 $376 $87 ($8) $1 $456 | |
| Q3 2025 Annualized Yield | |
| (4) | |
| 5.18% 3.96% 0.75% 10.19% 2.48% 3.00% | |
| Total interest earning assets were ~$62B at the end of Q4, and average yield was flat | |
| sequentially | |
| In millions, except for annualized yields | |
| Robinhood Earnings Presentation Q4 2025 | |
| (1) Includes cash and cash equivalents, restricted cash, segregated cash, cash equivalents, and securities under federal and other regulations, deposits with clearing organizations, and investments. | |
| (2) Credit card, net consists of i) an off-balance sheet amount representing customer principal amounts funded by Coastal Bank under the Program Agreement. Under the Program Agreement, | |
| Robinhood Credit collects interest from customers that carry a balance and pays interest on the amount funded by Coastal Bank, with the difference between those amounts resulting in net interest | |
| revenue and ii) an on-balance sheet amount representing purchased credit card receivables by the Credit Card Funding Trust. Robinhood Credit collects interest from customers that carry balances | |
| and pays interest on the amount funded through the Credit Card Funding Trust, with the difference in those amounts resulting in net interest revenues. As of December 31, 2025, the off-balance sheet | |
| amount funded under the Program agreement was $200 million and the on-balance sheet amount was $840 million. | |
| (3) Average balance rows represent the simple average of month-end balances in a given period. | |
| (4) Annualized yield is calculated by annualizing revenue for the given period and dividing by the applicable average asset balance. | |
| (5) Includes interest expenses related to our revolving credit facilities; interest expense related to the Credit Card Funding Trust is included in the credit card, net interest yield calculation. |
| investors.robinhood.com | 44 |
|---|---|
| $16.4 | |
| $19.0 | |
| $20.9 | |
| $24.5 | |
| $26.1 | |
| $28.2 | |
| $32.7 | |
| $35.4 | |
| $32.8 | |
| $10.1 | |
| $10.3 | |
| $10.2 | |
| $11.1 | |
| $9.9 | |
| $9.7 | |
| $14.0 | |
| $14.3 | |
| $11.0 | |
| $3.5 | |
| $4.1 | |
| $5.0 | |
| $5.5 | |
| $7.9 | |
| $8.8 | |
| $9.5 | |
| $13.9 | |
| $16.8 | |
| $30 | |
| $34 | |
| $36 | |
| $41 | |
| $44 | |
| $47 | |
| $57 | |
| $64 | |
| $62 | |
| Cash Sweep (off-balance sheet) Cash and deposits¹ Margin Book Credit card, net² | |
| Q4'23 Q1'24 Q2'24 Q3'24 Q4'24 Q1'25 Q2'25 Q3'25 | Q4'25 |
| In billions | |
| In Q4, Interest Earning Assets grew 39% year-over-year to $62billion | |
| (23%) | |
| +21% | |
| +11% | |
| +113% | |
| (4%)+39% | |
| +150% | +43% |
| Sequential | |
| change | |
| Year-over- | |
| year change | |
| $0.2 | |
| $0.2 | |
| $0.3 | |
| $0.2 | |
| +26% | (7%) |
| Includes corporate cash, investments, and segregated cash | |
| $0.4 | |
| Robinhood Earnings Presentation Q4 2025 | |
| $0.4 | |
| $0.6 | |
| (1) Includes cash and cash equivalents, restricted cash, segregated cash, cash equivalents, and securities under federal and other regulations, deposits with clearing organizations, and investments. | |
| (2) Credit card, net consists of i) an off-balance sheet amount representing customer principal amounts funded by Coastal Bank under the Program Agreement. Under the Program Agreement, Robinhood | |
| Credit collects interest from customers that carry a balance and pays interest on the amount funded by Coastal Bank, with the difference between those amounts resulting in net interest revenue and ii) | |
| an on-balance sheet amount representing purchased credit card receivables by the Credit Card Funding Trust. Robinhood Credit collects interest from customers that carry balances and pays interest on | |
| the amount funded through the Credit Card Funding Trust, with the difference in those amounts resulting in net interest revenues. As of December 31, 2025, the off-balance sheet amount funded under | |
| the Program agreement was $200 million and the on-balance sheet amount was $840 million. | |
| $0.7 | |
| $1 | |
| Cash and deposits decreased sequentially | |
| primarily due to higher margin lending and | |
| lower securities lending activity |

| investors.robinhood.com | 45 |
|---|---|
| Total securities lending revenue increased by 89% year-over-year to $132 million in Q4, | |
| and fully paid securities lending was 33% of total securities lending | |
| In millions, unless specified | |
| Total securities lending revenue, including interest on cash collateral | |
| Q4'24 Q1'25 Q2'25 Q3'25 Q4'25 | |
| 1 | |
| Year-over- | |
| year change | |
| Sequential | |
| change | |
| Securities lending, net (shown on p. 21) $26 $23 $54 $87 $26 —% (70%) | |
| Interest on cash collateral for margin based securities lending (included in Interest | |
| on segregated cash, securities, and deposits on p. 21) | |
| $44 $48 $58 $86 $106 +141% +23% | |
| Total securities lending revenue $70 $71 $112 $173 $132 +89% (24%) | |
| Breakdown of total securities lending revenue | |
| Margin based securities lending | |
| 2 | |
| $43 $43 $66 $112 $89 +107% (21%) | |
| Margin based as a percentage of total 61% 61% 59% 65% 67% | |
| Fully paid securities lending, net | |
| 2 | |
| $27 $28 $46 $61 $43 +59% (30%) | |
| Fully paid as a percentage of total 39% 39% 41% 35% 33% | |
| Fully paid securities lending metrics | |
| Funded Customers Enrolled (end of period, in millions) 4.0 4.6 5.1 5.6 6.1 +53% +9% | |
| Equity Total Platform Assets Enrolled (end of period, in billions) $38.7 $40.3 $52.1 $68.8 $75.9 +96% +10% | |
| (1) Securities lending, net decreased sequentially in Q4 2025 primarily due to reduced demand for hard-to-borrow securities. Interest on cash collateral increased sequentially in Q4 2025 primarily due to higher average securities lending balances in the quarter. | |
| (2) Figures shown are net of interest expense and estimated rebate costs. | |
| Robinhood Earnings Presentation Q4 2025 |

| investors.robinhood.com | 46 |
|---|---|
| Fully diluted shares decreased by 1.5% year-over-year as we continue to execute our | |
| $1.5B share buyback program and closely manage share-based compensation | |
| Price per Class A Share (End of period) $37.26 $41.62 $93.63 $143.18 $113.20 | |
| In millions, except prices and percentages December 31, 2024 March 31, 2025 June 30, 2025 September 30, 2025 December 31, 2025 | |
| December 31, 2025 | |
| Year-over-year change | |
| Class A shares outstanding 764.9 767.9 771.9 784.3 790.3 | |
| Class B shares outstanding 119.6 116.7 116.3 114.3 111.0 | |
| Basic shares 884.5 884.6 888.2 898.6 901.3 +1.9% | |
| Employee time-based RSUs outstanding 18.2 17.1 14.0 10.7 7.6 | |
| Employee stock options outstanding (in-the-money) | |
| 1 | |
| 7.8 6.1 4.7 3.5 3.0 | |
| Investor warrants (all at $26.60/share) outstanding (in-the-money) 12.9 12.1 10.8 9.1 8.7 | |
| Diluted shares | |
| 2 | |
| 923.4 919.9 917.7 921.9 920.6 (0.3%) | |
| Founders' pre-IPO market-based RSUs outstanding but not eligible to vest | |
| 3 | |
| 11.1 11.1 6.9 — — | |
| Fully diluted shares | |
| 2 | |
| 934.5 931.0 924.6 921.9 920.6 (1.5%) | |
| (1) In addition, employees hold purchase rights under the Employee Share Purchase Plan (ESPP). Historical issuances under the ESPP were 1.6M shares in May 2024, 0.7M shares in | |
| November 2024, 0.6M shares in May 2025, and 0.2M shares in November 2025. | |
| (2) Please note that under GAAP, for any period with a net loss, diluted EPS is calculated using basic shares; for any period with net income, diluted EPS is calculated using the treasury method | |
| for diluted shares, which may cause differences compared to diluted shares shown in this schedule dependent on Robinhood's share price. | |
| (3) The Founders' pre-IPO market-based RSUs become eligible to vest if our trailing 60-trading-day average daily VWAP reaches the following price points by 12/31/2025: $50.75 - 4.2M shares; | |
| $101.50 - 6.9M shares. All pre-IPO market-based RSUs fully vested in Q3 2025 following the achievement of price targets in Q2 and Q3. | |
| Robinhood Earnings Presentation Q4 2025 |

| investors.robinhood.com | 47 |
|---|---|
| Adjusted Operating Expenses and Adjusted Operating Expenses and SBC Reconciliation | |
| In millions |
Operating expenses (GAAP) Q4'23 Q1'24 Q2'24 Q3'24 Q4'24 Q1'25 Q2'25 Q3'25 Q4'25
Brokerage and transaction $32 $35 $40 $39 $50 $50 $48 $56 $57 Technology and development 197 196 209 205 208 214 214 237 232 Operations 26 28 28 27 29 31 29 33 37 Provision for credit losses
1
14 16 18 23 19 24 28 26 36 Marketing 43 67 64 59 82 105 99 102 93 General and administration 133 118 134 133 70 133 132 185 178 Total operating expenses $445 $460 $493 $486 $458 $557 $550 $639 $633 Less: SBC Q4'23 Q1'24 Q2'24 Q3'24 Q4'24 Q1'25 Q2'25 Q3'25 Q4'25 Brokerage and transaction $1 $2 $3 $2 $2 $2 $3 $2 $3 Technology and development 50 44 52 48 48 44 39 40 36 Operations 2 2 2 1 2 1 2 1 2 Marketing 2 2 1 3 2 2 2 2 2 General and administration 26 12 28 25 23 24 32 33 33 Total SBC $81 $62 $86 $79 $77 $73 $78 $78 $76 Less: Provision for credit losses Q4'23 Q1'24 Q2'24 Q3'24 Q4'24 Q1'25 Q2'25 Q3'25 Q4'25 Provision for credit losses
1
$— $— $— $— $— $24 $28 $26 $36 Total provision for credit losses $— $— $— $— $— $24 $28 $26 $36 Less: Significant legal and tax settlements and reserves Q4'23 Q1'24 Q2'24 Q3'24 Q4'24 Q1'25 Q2'25 Q3'25 Q4'25 General and administration $— $— $— $10 ($50) $— $— $— $— Total significant legal and tax settlements and reserves $— $— $— $10 ($50) $— $— $— $— Adjusted Operating Expenses (Non-GAAP) Q4'23 Q1'24 Q2'24 Q3'24 Q4'24 Q1'25 Q2'25 Q3'25 Q4'25 Brokerage and transaction $31 $33 $37 $37 $48 $48 $45 $54 $54 Technology and development 147 152 157 157 160 170 175 197 196 Operations 24 26 26 26 27 30 27 32 35 Provision for credit losses
1
14 16 18 23 19 — — — — Marketing 41 65 63 56 80 103 97 100 91 General and administration 107 106 106 98 97 109 100 152 145 Total Adjusted Operating Expenses $364 $398 $407 $397 $431 $460 $444 $535 $521 Adjusted Operating Expenses and SBC (Non-GAAP) Q4'23 Q1'24 Q2'24 Q3'24 Q4'24 Q1'25 Q2'25 Q3'25 Q4'25 Adjusted Operating Expenses $364 $398 $407 $397 $431 $460 $444 $535 $521 Add: SBC 81 62 86 79 77 73 78 78 76 Adjusted Operating Expenses and SBC $445 $460 $493 $476 $508 $533 $522 $613 $597
Certain reclassifications have been made to prior year amounts to conform to the current year presentation. The impact of these reclassifications is immaterial to the presentation of the financials taken as a whole. (1) Starting in Q1 2025, Adjusted Operating Expenses and Adjusted Operating Expenses and SBC no longer include provision for credit losses.
Robinhood Earnings Presentation Q4 2025

| investors.robinhood.com | 48 |
|---|---|
| Adjusted Operating Expenses and SBC Reconciliation | |
| In millions | |
| 2017 2018 2019 2020 2021 2022 2023 2024 2025 | |
| Total operating expenses (GAAP) $57 $231 $384 $945 $3,456 $2,369 $2,401 $1,897 $2,379 | |
| Less: Provision for credit losses | |
| 1 | |
| $— $— $— $— $— $— $— $— $114 | |
| Less: SBC | |
| SBC Excluding 2021 Founders Award Cancellation 1 55 27 24 1,572 654 386 304 305 | |
| 2021 Founders Award Cancellation — — — — — — 485 — — | |
| Less: Significant legal and tax settlements and reserves — — — 102 55 20 104 (40) — | |
| Less: Restructuring Charges — — — — — 105 — — — | |
| Less: Q4 2022 Processing Error — — — — — 57 — — — | |
| Adjusted Operating Expenses (non-GAAP) $56 $176 $357 $819 $1,829 $1,533 $1,426 $1,633 $1,960 | |
| Add: SBC | |
| SBC Excluding 2021 Founders Award Cancellation 1 55 27 24 1,572 654 386 304 305 | |
| 2021 Founders Award Cancellation — — — — — — 485 — — | |
| Adjusted Operating Expenses and SBC (non-GAAP) $57 $231 $384 $843 $3,401 $2,187 $2,297 $1,937 $2,265 | |
| Robinhood Earnings Presentation Q4 2025 | |
| (1) Starting in Q1 2025, Adjusted Operating Expenses and Adjusted Operating Expenses and SBC no longer include provision for credit losses. |

| investors.robinhood.com | 49 |
|---|---|
| Adjusted EBITDA and Adjusted EBITDA Margin Reconciliations | |
| In millions | |
| Q4'23 Q1'24 Q2'24 Q3'24 Q4'24 Q1'25 Q2'25 Q3'25 Q4'25 | |
| Net income (loss) $30 $157 $188 $150 $916 $336 $386 $556 $605 | |
| Net margin | |
| 1 | |
| 6% 25% 28% 24% 90% 36% 39% 44% 47% | |
| Add: Interest expenses related to credit facilities 6 6 6 6 6 6 8 8 10 | |
| Add: Provision for (benefit from) income taxes (1) 5 3 3 (358) 35 56 78 56 | |
| Add: Depreciation and amortization 17 17 18 20 22 20 21 22 23 | |
| EBITDA (Non-GAAP) $52 $185 $215 $179 $586 $397 $471 $664 $694 | |
| Add: | |
| SBC 81 62 86 79 77 73 78 78 76 | |
| Significant legal and tax settlements and reserves — — — 10 (50) — — — — | |
| Unrealized gains in non-marketable equity securities | |
| 2 | |
| — — — — — — — — (9) | |
| Adjusted EBITDA (Non-GAAP) $133 $247 $301 $268 $613 $470 $549 $742 $761 | |
| Adjusted EBITDA Margin (Non-GAAP) | |
| 3 | |
| 28% 40% 44% 42% 60% 51% 56% 58% 59% | |
| (1) Net margin is calculated as net income (loss) divided by total net revenues. | |
| (2) For the three months ended December 31, 2025, unrealized gains in non-marketable equity securities are primarily related to investments held by Robinhood Ventures Fund I. | |
| (3) Adjusted EBITDA Margin is calculated as Adjusted EBITDA divided by total net revenues. | |
| Robinhood Earnings Presentation Q4 2025 |
| investors.robinhood.com | 50 |
|---|---|
| Adjusted EBITDA and Adjusted EBITDA Margin Reconciliations | |
| In millions | |
| 2017 2018 2019 2020 2021 2022 2023 2024 2025 | |
| Net income (loss) ($6) ($57) ($107) $7 ($3,687) ($1,028) ($541) $1,411 $1,883 | |
| Net margin | |
| 1 | |
| (12%) (34%) (38%) 1% (203%) (76%) (29%) 48% 42% | |
| Add: Interest expenses related to credit facilities — — 1 5 20 24 23 24 32 | |
| Add: Provision for (benefit from) income taxes — 1 (1) 6 2 1 8 (347) 225 | |
| Add: Depreciation and amortization 1 2 6 10 26 61 71 77 86 | |
| EBITDA (Non-GAAP) ($5) ($54) ($101) $28 ($3,639) ($942) ($439) $1,165 $2,226 | |
| Add: SBC excluding 2021 Founders Award Cancellation 1 55 27 24 1,572 654 386 304 305 | |
| Add: 2021 Founders Award Cancellation — — — — — — 485 — — | |
| Add: Significant legal and tax settlements and reserves — — — 102 55 20 104 (40) — | |
| Add: Restructuring charges — — — — — 105 — — — | |
| Add: Q4 2022 Processing Error — — — — — 57 — — — | |
| Add: Impairment of Ziglu equity securities — — — — — 12 — — — | |
| Add: Change in fair value of convertible notes and warrant liability — — — — 2,045 — — — — | |
| Add: Unrealized gains in non-marketable equity securities | |
| 2 | |
| — — — — — — — — (9) | |
| Adjusted EBITDA (Non-GAAP) ($4) $1 ($74) $154 $33 ($94) $536 $1,429 $2,522 | |
| Adjusted EBITDA Margin (Non-GAAP) | |
| 3 | |
| (8%) 1% (27%) 16% 2% (7%) 29% 48% 56% | |
| (1) Net margin is calculated as net income (loss) divided by total net revenues. | |
| (2) For the year ended December 31, 2025, unrealized gains in non-marketable equity securities are primarily related to investments held by Robinhood Ventures Fund I. | |
| (3) Adjusted EBITDA Margin is calculated as Adjusted EBITDA divided by total net revenues. | |
| Robinhood Earnings Presentation Q4 2025 |

| investors.robinhood.com | 51 |
|---|---|
| Q4'24 | |
| Diluted EPS (GAAP) $1.01 | |
| Less: Tax Benefit and Regulatory Accrual Reversal | |
| 1 | |
| (0.47) | |
| EPS Prior to Tax Benefit and Regulatory Accrual Reversal (Non-GAAP) $0.54 | |
| Q4 2024 Net Income Prior to Tax Benefit and Regulatory Accrual Reversal and Q4 2024 | |
| EPS Prior to Tax Benefit and Regulatory Accrual Reversal Reconciliations | |
| Q4'24 | |
| Net income (GAAP) $916 | |
| Less: Tax Benefit and Regulatory Accrual Reversal | |
| 1 | |
| (424) | |
| Net Income Prior to Tax Benefit and Regulatory Accrual Reversal (Non-GAAP) $492 | |
| Q4 2024 Net Income Prior to Tax Benefit and Regulatory Accrual Reversal | |
| In millions | |
| Q4 2024 EPS Prior to Tax Benefit and Regulatory Accrual Reversal | |
| (1) In Q4 2024, the Company recorded a $369 million deferred tax benefit ($0.41 of diluted EPS), primarily from the release of the Company's valuation allowance on most of its net deferred tax assets, as | |
| well as a $55 million benefit ($0.06 of diluted EPS) due to a reversal of an accrual as part of a regulatory settlement. Together, these items represented a $424 million benefit ($0.47 of diluted EPS) in Q4 2024. | |
| Robinhood Earnings Presentation Q4 2025 |

| investors.robinhood.com | 52 |
|---|---|
| Incremental Net Income and Incremental Adjusted EBITDA Margins | |
| In millions | |
| Q4'24 Q1'25 Q2'25 Q3'25 Q4'25 2025 | |
| Year-over-year change in total net revenues +$543 +$309 +$307 +$637 +$269 +$1,522 | |
| Year-over-year change in net income +$886 +$179 +$198 +$406 ($311) +$472 | |
| Incremental net income margins | |
| 1 | |
| NM 58% 64% 64% NM NM | |
| Year-over-year change in Adjusted EBITDA (non-GAAP) +$480 +$223 +$248 +$474 +$148 +$1,093 | |
| Incremental Adjusted EBITDA Margins (non-GAAP) | |
| 2 | |
| 88% 72% 81% 74% 55% 72% | |
| (1) Defined as year-over-year change in net income divided by year-over-year change in total net revenues. | |
| (2) Defined as year-over-year change in Adjusted EBITDA (non-GAAP) divided by year-over-year change in total net revenues. | |
| Robinhood Earnings Presentation Q4 2025 |

| investors.robinhood.com | 53 |
|---|---|
| Definitions | |
| Key Performance Metrics | |
| Funded Customers | |
| We define a Funded Customer as a unique person who has at least one account with a Robinhood entity and, within the past 45 calendar days (a) had an account balance that was greater than zero | |
| (excluding amounts that are deposited into a Funded Customer account by the Company with no action taken by the unique person) or (b) completed a transaction using any such account. Individuals who | |
| share a funded joint investing account (which launched in July 2024) are each considered to be a Funded Customer. Starting in Q1 2025, individuals who are customers of Registered Investment Advisors | |
| ("RIAs") that use the TradePMR platform, and, starting in June 2025, customers of Bitstamp, are also considered Funded Customers. | |
| Total Platform Assets | |
| We define Total Platform Assets as the sum of the fair value of all equities, options, cryptocurrency, futures (including options on futures and swaps, including event contracts), cash held by users in their | |
| accounts, net of receivables from users (previously reported as Assets Under Custody), and any such assets managed by RIAs using TradePMR’s platform that are not custodied by Robinhood, as of a | |
| stated date or period end on a trade date basis. Net Deposits and net market gains (losses) drive the change in Total Platform Assets in any given period. Starting in June 2025, the fair value of all | |
| cryptocurrency includes cryptocurrency on Bitstamp. | |
| Assets Under Custody | |
| We define Assets Under Custody as Total Platform Assets, excluding assets managed by RIAs using TradePMR's platform that are not custodied by Robinhood, as of a stated date or period end on a trade | |
| date basis. | |
| Net Deposits | |
| We define Net Deposits as all cash deposits and asset transfers from customers, as well as dividends, interest, staking rewards, and cash or assets earned in connection with Company promotions (such as | |
| account transfer and retirement match incentives, free stock bonuses) received by customers, net of reversals, customer cash withdrawals, margin and lending interest, Robinhood Gold subscription fees, | |
| and assets transferred off of our platforms for a stated period. Prior to the second quarter of 2024, Net Deposits did not include inflows from cash or assets earned in connection with Company promotions | |
| and prior to January 2024, Net Deposits did not include inflows from dividends and interest or outflows from Robinhood Gold subscription fees and margin interest, although we have not restated amounts in | |
| prior periods as the impact to those figures was immaterial. Starting in June 2025, Net Deposits include results from Bitstamp. Due to data limitations, we have not included TradePMR client figures in our Net | |
| Deposits key performance metric. | |
| Average Revenue Per User (“ARPU”) | |
| We define ARPU as total revenue for a given period divided by the average number of Funded Customers on the last day of that period and the last day of the immediately preceding period. | |
| Figures in this presentation represent ARPU annualized for each three-month period presented. | |
| Robinhood Gold Subscribers | |
| We define a Robinhood Gold Subscriber as a unique person who has at least one account with a Robinhood entity and who, as of the end of the relevant period (a) is subscribed to Robinhood Gold and (b) | |
| has made at least one Robinhood Gold subscription fee payment. | |
| Additional Operating Metrics | |
| Robinhood Retirement AUC | |
| We define Robinhood Retirement AUC as the total Assets Under Custody in traditional individual retirement accounts (“IRAs") and Roth IRAs. This does not include accounts with an RIA using TradePMR’s | |
| platform. | |
| Cash Sweep | |
| We define Cash Sweep as the period-end total amount of participating users’ uninvested brokerage and banking cash that has been automatically “swept” or moved from their accounts into deposits for their | |
| benefit at a network of program banks. This is an off-balance-sheet amount. Robinhood earns a net interest spread on Cash Sweep balances based on the interest rate offered by the banks less the interest | |
| rate given to users as stated in our program terms. This includes balances from customers of RIAs using TradePMR’s platform. | |
| Margin Book | |
| We define Margin Book as our period-end aggregate outstanding margin loan balances receivable (i.e., the period-end total amount we are owed by customers on loans made for the purchase of securities, | |
| supported by a pledge of assets in their margin-enabled brokerage accounts). This includes margin loan balances from customers of RIAs using TradePMR’s platform. | |
| Notional Trading Volume | |
| We define Notional Trading Volume, or Notional Volume, for any specified asset class as the aggregate dollar value (purchase price or sale price as applicable) of trades executed in that asset class on our | |
| platforms over a specified period of time. Crypto Notional Volume includes both Robinhood App Notional Volume and, starting in June 2025, Bitstamp Notional Volume. Robinhood App Notional Volume | |
| represents the dollar value of executed crypto trades on the Robinhood platform over a specified period of time. Bitstamp Notional Volume represents the dollar value of executed crypto trades on the | |
| Bitstamp platform over a specified period of time. For example, each $1 of transaction value executed between a buyer and seller is counted as $1 of transaction value in the relevant period, rather than $2 if | |
| counted for each of the buyer and seller. | |
| Options Contracts Traded | |
| We define Options Contracts Traded as the total number of options contracts bought or sold over a specified period of time. Each contract generally entitles the holder to trade 100 shares of the underlying | |
| stock. | |
| Event Contracts Traded | |
| We define Event Contracts Traded as the total number of event contracts bought or sold over a specified period of time through our Prediction Markets Hub. Each contract can be traded at $0.01 increments | |
| up to $1 and is worth $1 upon settlement. | |
| Futures Contracts Traded | |
| We define Futures Contracts Traded as the total number of futures contracts bought or sold over a specified period of time. While contract specifications vary, futures contracts generally represent | |
| agreements to buy or sell an asset at a specific price at a future date. Event contracts are not included within Futures Contracts Traded. | |
| Total Trading Volumes | |
| Total Trading Volumes represent Notional Trading Volumes for Equity and Crypto, and Options Contracts Traded for Options and Event Contracts Traded for Event Contracts. | |
| Monthly Active Users (“MAU”) | |
| We define MAUs as the number of unique persons who, using one or more accounts with a Robinhood entity, meet one of the following criteria at any point during a specified calendar month: a) executes a | |
| debit card or credit card transaction, b) transitions between two different screens on a mobile device while logged into their account or c) loads a page in a web browser while logged into their account. A | |
| person need not satisfy these conditions on a recurring monthly basis or be a Funded Customer to be included in MAU. MAU figures in this presentation reflect MAU for the last month of the relevant period | |
| presented. We utilize MAU to measure how many customers interact with our products and services during a given month. MAU does not measure the frequency or duration of the interaction, but we | |
| consider it a useful indicator for engagement. Additionally, MAUs are positively correlated with, but are not indicative of, the performance of revenue and other key performance indicators. | |
| Glossary Terms | |
| Churned Customers | |
| A Funded Customer is considered “Churned” if it was ever a New Funded Customer whose account balance (measured as the fair value of assets in the account less any amount due from the user and | |
| excluding amounts that are deposited into a Funded Customer account by the Company with no action taken by the unique person) drops to or below zero and has not completed a transaction using any | |
| account with a Robinhood entity for at least 45 consecutive calendar days. Negative balances typically result from Fraudulent Deposit Transactions (which occur when users initiate deposits into their | |
| accounts, make trades on our platforms using a short-term extension of credit from us, and then repatriate or reverse the deposits, resulting in a loss to us of the credited amount) and unauthorized debit card | |
| use, and less often, from margin loans. | |
| Daily Average Revenue Trades (“DARTs”) | |
| We define DARTs for any asset class as the total number of revenue generating retail trades for such asset class executed during a given period divided by the number of trading days for such asset class in | |
| that period. This does not include DARTs from Bitstamp Institutional. The monthly metrics slide discloses each month’s number of trading days for equities and options. For crypto, the number of trading days | |
| is equal to the number of calendar days in the month. | |
| Free Credit Balances and Other | |
| We define Free Credit Balances and Other as the period-end total amount of users' uninvested cash in their accounts that is not participating in the "Cash Sweep" program. | |
| Robinhood Gold Adoption Rate | |
| We define the Robinhood Gold adoption rate as end of period Robinhood Gold Subscribers divided by end of period Funded Customers. | |
| Growth Rate and Annualized Growth Rate with respect to Net Deposits | |
| Growth rate is calculated as aggregate Net Deposits over a specified 12-month period, divided by Total Platform Assets for the fiscal quarter that immediately precedes such 12-month period. Annualized | |
| growth rate is calculated as Net Deposits for a specified quarter multiplied by 4 and divided by Total Platform Assets for the immediately preceding quarter. | |
| Investment Accounts | |
| We define an Investment Account as a funded individual brokerage account, a funded joint investing account, a funded IRA, or an account with an RIA using TradePMR’s platform. Starting in | |
| September 2025, a Funded Customer can have multiple Investment Accounts - one or more individual brokerage accounts, a joint investing account, a traditional IRA, a Roth IRA, and/or an RIA | |
| custody account using TradePMR’s platform. Investment Accounts do not include Bitstamp as such accounts are not brokerage or other Investment Accounts. | |
| Net Cash Held by Users | |
| We Define Net Cash Held by Users as cash held by users in their accounts, net of receivables from users. | |
| New Funded Customers | |
| We define a New Funded Customer as a unique person who became a Funded Customer for the first time during the relevant period. | |
| Resurrected Customers | |
| A Funded Customer is considered “Resurrected” in a stated period if it was a Churned Customer as of the end of the immediately preceding period and its balance (excluding amounts that are deposited into | |
| a Funded Customer account by the Company with no action taken by the unique person) rises above zero or it completes a transaction using its account. | |
| Revenue per Employee | |
| Revenue per Employee is calculated by multiplying the quarterly total net revenues by four and dividing by average employee count for the quarter. | |
| Total Securities Lending Revenue | |
| Total Securities Lending Revenue includes net rebates and interest on cash collateral for both margin based and fully paid securities lending. | |
| 2019 CEO Market-Based RSUs | |
| We define 2019 CEO Market-Based RSUs as the restricted stock units we granted to our Chairman and Chief Executive Officer, Vlad Tenev, in 2019 under which vesting was conditioned upon both the | |
| achievement of share price targets and the continued employment over defined service periods. As of September 30, 2025, all of the remaining 2019 CEO Market-Based RSUs were fully vested. | |
| Robinhood Earnings Presentation Q4 2025 |

| investors.robinhood.com | 54 |
|---|---|
| SBC excluding the 2021 Founders Award Cancellation | |
| We define SBC excluding the 2021 Founders Award Cancellation as GAAP SBC minus the impact of the 2021 Founders Award Cancellation, which we do not believe is indicative of our ongoing expenses. | |
| The amount and timing of the 2021 Founders Award Cancellation are not driven by core results of operations and renders comparisons with prior periods less meaningful. | |
| 2021 Founders Award Cancellation | |
| We define the 2021 Founders Award Cancellation as the cancellation in February 2023 of the 2021 pre-IPO market-based restricted stock units granted to our founders of 35.5 million unvested shares. | |
| Q4 2022 Processing Error | |
| Delays in notification from third parties and process failures within Robinhood’s brokerage systems and operations in connection with the handling of a 1-for-25 reverse stock split transaction of Cosmos | |
| Health, Inc. (“COSM”), a NASDAQ-listed company, on December 16, 2022, allowed customers, for a limited time, to execute trades selling more shares than they held in their accounts. This caused a | |
| temporary short position in that ticker symbol which Robinhood covered out of corporate cash within the same trading day. The resulting loss of $57 million is recorded within brokerage and transaction in the | |
| consolidated statement of operations. | |
| Impairment of Ziglu equity securities | |
| Partially as a result of the termination of the stock purchase agreement, which occurred in February 2023, the advances made to Ziglu Limited accounted for as non-marketable equity securities were | |
| impaired to a carrying value of zero. | |
| Q4 2024 Tax Benefit and Regulatory Accrual Reversal | |
| In Q4 2024, the Company recorded a $369 million deferred tax benefit ($0.41 of diluted EPS), primarily from the release of the Company's valuation allowance on most of its net deferred tax assets, | |
| as well as a $55 million benefit ($0.06 of diluted EPS) due to a reversal of an accrual as part of a regulatory settlement. Together, these items represented a $424 million benefit ($0.47 of diluted | |
| EPS) in Q4 2024. | |
| Q4 2024 Net Income Prior to Tax Benefit and Regulatory Accrual Reversal and Q4 2024 EPS Prior to Tax Benefit and Regulatory Accrual Reversal | |
| Q4 2024 Net Income Prior to Tax Benefit and Regulatory Accrual Reversal is defined as GAAP net income minus the impact of the Q4 2024 Tax Benefit and Regulatory Accrual Reversal, and Q4 2024 | |
| EPS Prior to Tax Benefit and Regulatory Accrual Reversal is defined as GAAP diluted EPS minus the impact of the Q4 2024 Tax Benefit and Regulatory Accrual Reversal. | |
| 2026 Outlook | |
| The paragraph below provides information on our 2026 expense plan and outlook. We are not providing a 2026 outlook for total operating expenses and have not reconciled our 2026 outlook for | |
| Adjusted Operating Expenses and SBC to the most directly comparable GAAP financial measure, total operating expenses, because we are unable to predict with reasonable certainty the impact of | |
| certain items without unreasonable effort. These items include, but are not limited to, provision for credit losses and significant regulatory expenses which may be material and could have a | |
| significant impact on total operating expenses for 2026. | |
| Our 2026 expense plan is designed to accelerate product velocity, drive Net Deposit growth, and grow revenues. This expense outlook includes growth investments in new or recently launched | |
| products and features, marketing, international expansion, full year costs related to the 2025 acquisitions of TradePMR and Bitstamp, and rapid growth in existing core products; while also driving | |
| rapid growth in existing core products and productivity and efficiency gains in our existing businesses. Our outlook for 2026 Adjusted Operating Expenses and SBC is $2.6 billion to $2.725 billion, | |
| which represents 18% year-over-year growth at the midpoint relative to 2025 Adjusted Operating Expenses and SBC. This expense outlook does not include provision for credit losses, costs related | |
| to our pending acquisitions, costs related to the Rothera joint venture, costs from modifications of executive awards in connection with our CFO transition, potential significant regulatory matters, or | |
| other significant expenses (such as impairments, restructuring charges, and other business acquisition- or disposition-related expenses) that may arise or accruals we may determine in the future | |
| are required, as we are unable to accurately predict the size or timing of such matters, expenses or accruals at this time. | |
| Actual results might differ materially from our outlook due to several factors, including the rate of growth in Funded Customers and our effectiveness to cross-sell products which affects variable | |
| marketing costs, the degree to which we are successful in managing credit losses and preventing fraud, and our ability to manage web-hosting expenses efficiently, among other factors. See “Non- | |
| GAAP Financial Measures” for more information on Adjusted Operating Expenses and SBC, including significant items that we believe are not indicative of our ongoing expenses that would be | |
| adjusted out of total operating expenses (GAAP) to get to Adjusted Operating Expenses and SBC (non-GAAP) should they occur. | |
| Definitions (Continued) | |
| Non-GAAP Financial Measures | |
| We collect and analyze operating and financial data to evaluate the health of our business, allocate our resources and assess our performance. In addition to total net revenues, net income, and other results | |
| under GAAP, we utilize non-GAAP calculations of Adjusted EBITDA, Adjusted EBITDA Margin, Incremental Adjusted EBITDA Margin, Adjusted Operating Expenses, Adjusted Operating Expenses and | |
| Share-Based Compensation ("SBC"), Adjusted Operating Expenses and SBC excluding the 2021 Founders Award Cancellation, SBC excluding the 2021 Founders Award Cancellation, Q4 2024 Net Income | |
| Prior to Tax Benefit and Regulatory Accrual Reversal, and Q4 2024 EPS Prior to Tax Benefit and Regulatory Accrual Reversal. This non-GAAP financial information is presented for supplemental | |
| informational purposes only, should not be considered in isolation or as a substitute for, or superior to, financial information presented in accordance with GAAP, and may be different from similarly titled non- | |
| GAAP measures used by other companies. We believe each of these non-GAAP measures provides useful information to investors and others in understanding and evaluating our results of operations, as | |
| well as providing a useful measure for period-to-period comparisons of our business performance and cost structure, as applicable. These non-GAAP measures are used by our management internally to | |
| make operating decisions, including those related to operating expenses, evaluate performance, and perform strategic planning and annual budgeting. Reconciliations of these non-GAAP measures to the | |
| most directly comparable financial measures calculated and presented in accordance with GAAP are provided in the financial tables included in this presentation. | |
| Adjusted EBITDA | |
| Adjusted EBITDA is defined as net income, excluding (i) interest expenses related to credit facilities, (ii) provision for (benefit from) income taxes, (iii) depreciation and amortization, (iv) SBC, (v) significant | |
| legal and tax settlements and reserves, and (vi) other significant gains, losses, and expenses (such as impairments, restructuring charges, and business acquisition- or disposition-related expenses) that we | |
| believe are not indicative of our ongoing results. | |
| The above items are excluded from our Adjusted EBITDA measure because these items are non-cash in nature, or because the amount and timing of these items are unpredictable, are not driven by core | |
| results of operations, and render comparisons with prior periods and competitors less meaningful. Adjusted EBITDA is a key measurement used by our management internally to make operating decisions, | |
| including those related to operating expenses, evaluate performance, and perform strategic planning and annual budgeting. | |
| Adjusted EBITDA Margin | |
| Adjusted EBITDA Margin is calculated as Adjusted EBITDA divided by total net revenues. The most directly comparable GAAP measure is net margin (calculated as net income divided by total net | |
| revenues). | |
| Incremental Adjusted EBITDA Margin | |
| Incremental Adjusted EBITDA Margin is defined as year-over-year change in Adjusted EBITDA (non-GAAP) divided by year-over-year change in total net revenues. | |
| Adjusted Operating Expenses | |
| Adjusted Operating Expenses is defined as GAAP total operating expenses minus (i) SBC, (ii) provision for credit losses, (iii) significant legal and tax settlements and reserves, and (iv) other | |
| significant expenses (such as impairments, restructuring charges, and business acquisition- or disposition-related expenses) that we believe are not indicative of our ongoing expenses. The | |
| amount and timing of the excluded items are unpredictable, are not driven by core results of operations, and render comparisons with prior periods less meaningful. Starting in Q1 2025, Adjusted | |
| Operating Expenses no longer includes provision for credit losses. | |
| Adjusted Operating Expenses and SBC | |
| Adjusted Operating Expenses and SBC is defined as GAAP total operating expenses minus (i) provision for credit losses, (ii) significant legal and tax settlements and reserves, and (iii) other | |
| significant expenses (such as impairments, restructuring charges, and business acquisition- or disposition-related expenses), that we believe are not indicative of our ongoing expenses. The | |
| amount and timing of the excluded items are unpredictable, are not driven by core results of operations, and render comparisons with prior periods less meaningful. Unlike Adjusted Operating | |
| Expenses, Adjusted Operating Expenses and SBC does not adjust for SBC except for in 2026 as it relates to modification of executive awards related to our CFO transition. Starting in Q1 2025, | |
| Adjusted Operating Expenses and SBC no longer includes provision for credit losses. | |
| Adjusted Operating Expenses and SBC excluding the 2021 Founders Award Cancellation | |
| Adjusted Operating Expenses and SBC excluding the 2021 Founders Award Cancellation is defined as GAAP total operating expenses minus (i) significant legal and tax settlements and reserves, (ii) other | |
| significant expenses (such as impairments, restructuring charges, and business acquisition- or disposition-related expenses), and (iii) the 2021 Founders Award Cancellation, that we believe are not | |
| indicative of our ongoing expenses. The amount and timing of the excluded items are unpredictable, are not driven by core results of operations, and render comparisons with prior periods less meaningful. | |
| Robinhood Earnings Presentation Q4 2025 |