
Q4 FY25 Earnings Announcement
November 25, 2025

Forward-looking Statements
This presentation contains forward-looking statements based on current expectations and assumptions that involve risks and uncertainties. If the risks or uncertainties ever materialize or the assumptions prove incorrect, they could affect the business and results of operations of HP Inc. and its consolidated subsidiaries ("HP") which may differ materially from those expressed or implied by such forward-looking statements and assumptions.
All statements other than statements of historical fact are statements that could be deemed forward-looking statements, including, but not limited to, projections of net revenue, margins, expenses, effective tax rates, net earnings, net earnings per share, cash flows, benefit plan funding, deferred taxes, share repurchases, foreign currency exchange rates or other financial items; any projections of the amount, timing or impact of cost savings or restructuring and other charges, planned structural cost reductions and productivity initiatives; any statements of the plans, strategies and objectives of management for future operations, including, but not limited to, our business model and transformation, our sustainability goals, our go-to-market strategy, the execution of restructuring plans and any resulting cost savings (including the fiscal 2023 plan and the fiscal 2026 plan), net revenue or profitability improvements or other financial impacts; any statements concerning the expected development, demand, performance, market share or competitive performance relating to products or services; any statements concerning potential supply constraints, component shortages, manufacturing disruptions or logistics challenges; any statements regarding current or future macroeconomic trends or events, including global trade policies, and the impact of those trends and events on HP and its financial performance; any statements regarding pending investigations, claims, disputes or other litigation matters; any statements of expectation or belief as to the timing and expected benefits of acquisitions and other business combination and investment transactions; and any statements of assumptions underlying any of the foregoing. Forward-looking statements can also generally be identified by words such as "future," "anticipates," "believes," "estimates," "expects," "intends," "plans," "predicts," "projects," "will," "would," "could," "can," "may," and similar terms.
Risks, uncertainties and assumptions that could affect our business and results of operations include factors relating to HP's ability to execute on its strategic plans, including the previously announced initiatives, business model changes and transformation; the development and transition of new products and services and the enhancement of existing products and services to meet evolving customer needs and respond to emerging technological trends, including artificial intelligence; the use of artificial intelligence; the impact of macroeconomic and geopolitical trends, changes and events, including global trade policies, the ongoing military conflict in Ukraine, continued instability in the Middle East or tensions in the Taiwan Strait and South China Sea and the regional and global ramifications of these events; volatility in global capital markets and foreign currency, changes in benchmark interest rates, the effects of inflation and instability of financial institutions; risks associated with HP's international operations and the effects of business disruption events, including those resulting from climate change; the need to manage (and reliance on) third-party suppliers, including with respect to supply constraints and component shortages, and the need to manage HP's global, multi-tier distribution network and potential misuse of pricing programs by HP's channel partners, adapt to new or changing marketplaces and effectively deliver HP's services; the execution and performance of contracts by HP and its suppliers, customers, clients and partners, including logistical challenges with respect to such execution and performance; the competitive pressures faced by HP's businesses; the impact of third-party claims of IP infringement; successfully innovating, developing and executing HP's go-to-market strategy, including online, omnichannel and contractual sales, in an evolving distribution, reseller and customer landscape; successfully competing and maintaining the value proposition of HP's products, including supplies and services; challenges to HP's ability to accurately forecast inventories, demand and pricing, which may be due to HP's multi-tiered channel, sales of HP's products to unauthorized resellers or unauthorized resale of HP's products or our uneven sales cycle; the hiring and retention of key employees; the results of our restructuring plans (including the fiscal 2023 plan and the fiscal 2026 plan), including estimates and assumptions related to the cost (including any possible disruption of HP's business) and the anticipated benefits of our restructuring plans; the protection of HP's intellectual property assets, including intellectual property licensed from third parties; disruptions in operations from system security risks, data protection breaches, or cyberattacks; HP's ability to maintain its credit rating, satisfy its debt obligations and complete any contemplated share repurchases, other capital return programs or other strategic transactions; changes in estimates and assumptions HP makes in connection with the preparation of its financial statements; the impact of changes to federal, state, local and foreign laws and regulations, including environmental regulations and tax laws; integration and other risks associated with business combination and investment transactions; our aspirations related to environmental and societal matters; potential impacts, liabilities and costs from pending or potential investigations, claims and disputes; the effectiveness of our internal control over financial reporting; and other risks that are described in HP's Annual Report on Form 10-K for the fiscal year ended October 31, 2024 and HP's other filings with the Securities and Exchange Commission ("SEC"). HP's fiscal 2023 plan included HP's efforts to take advantage of future growth opportunities, including but not limited to, investments to drive growth, investments in our people, improving product mix, driving structural cost savings and other productivity measures. HP's fiscal 2026 plan includes HP's efforts to drive customer satisfaction, product innovation, and productivity through artificial intelligence adoption and enablement, and cost savings associated with the fiscal 2026 plan represent gross reductions in costs from these restructuring plans. Structural cost savings represent gross reductions in costs driven by operational efficiency, digital transformation, and portfolio optimization. These initiatives include but are not limited to workforce reductions, platform simplification, programs consolidation and productivity measures undertaken by HP, which HP expects to be sustainable in the longer-term. These structural cost savings are net of any new recurring costs resulting from these initiatives and exclude one-time investments to generate such savings. HP's expectations on the longer-term sustainability of such structural cost savings are based on its current business operations and market dynamics and could be significantly impacted by various factors, including but not limited to HP's evolving business models, future investment decisions, market environment and technology landscape.
As in prior periods, the financial information set forth in this document, including any tax-related items, reflects estimates based on information available at this time. While HP believes these estimates to be reasonable, these amounts could differ materially from reported amounts in HP's Annual Report on Form 10-K for the fiscal year ending October 31, 2025 and October 31, 2026, Quarterly Report on Form 10-Q for the fiscal quarter ending January 31, 2026 and HP's other filings with the SEC. The forward-looking statements in this document are made as of the date of this document and HP assumes no obligation and does not intend to update these forward-looking statements.
HP's Investor Relations website at investor.hp.com contains a significant amount of information about HP, including financial and other information for investors. HP encourages investors to visit its website from time to time, as information is updated and new information is posted. The content of HP's website is not incorporated by reference into this presentation or in any other report or document HP files with the SEC, and any references to HP's website are intended to be inactive textual references only.
Use of Non-GAAP Financial Information
HP has included non-GAAP financial measures in this presentation to supplement HP's consolidated financial statements presented on a generally accepted accounting principles ("GAAP") basis. Definitions of these non-GAAP financial measures and reconciliations of these non-GAAP financial measures to the most directly comparable GAAP financial measures are included elsewhere in this presentation. HP's management uses net revenue on a constant currency basis, non-GAAP total operating expenses, non-GAAP operating profit, non-GAAP operating margin, non-GAAP other income and expenses, non-GAAP tax rate, non-GAAP net earnings, non-GAAP diluted net earnings per share, and other non-GAAP financial measures to evaluate and forecast HP's performance before gains, losses or other charges that are considered by HP's management to be outside of HP's core business segment operating results. Gross cash, net cash (debt), and free cash flow are liquidity measures that provide useful information to management about the amount of cash available for investment in HP's businesses, funding acquisitions, repurchasing stock and other purposes. Net cash (debt) provides useful information to management about the state of HP's consolidated balance sheet.
These and the other non-GAAP financial measures that HP uses may have limitations as analytical tools, and these measures should not be considered in isolation or as a substitute for analysis of HP's results as reported under GAAP. For example, items such as amortization of intangible assets, though not directly affecting HP's cash position, represent the loss in value of intangible assets over time and therefore does not reflect the full economic effect of the change in value of those intangible assets. Amortization of intangible assets, restructuring and other charges, certain litigation (benefits) charges, net and acquisition and divestiture charges are not included in non-GAAP operating expenses, non-GAAP operating profit, non-GAAP operating margin, non-GAAP tax rate, non-GAAP net earnings, and non-GAAP diluted net earnings per share. In addition, non-operating retirement-related (credits)/charges, debt extinguishment costs (benefit), certain litigation (benefits) charges, net and tax adjustments are excluded from non-GAAP other income and expenses, non-GAAP tax rate, non-GAAP net earnings and non-GAAP diluted net EPS. These items can have a material impact on the equivalent GAAP earnings measure and cash flows. HP may not be able to immediately liquidate the short-term and long-term investments included in gross cash, which may limit the usefulness of gross cash as a liquidity measure. In addition, free cash flow, which includes cash provided by (used in) operating activities adjusted for net investment in leases from integrated financing and net property, plant, and equipment and purchased intangibles, does not represent the total increase or decrease in cash for the period. The non-GAAP financial information that we provide also may differ from the non-GAAP information provided by other companies. We account for the limitations on our use of these non-GAAP financial measures by relying primarily on our GAAP financial statements and using non-GAAP financial measures only supplementally. We also provide reconciliations of each non-GAAP financial measure to the most directly comparable GAAP measure, and we encourage investors to review those reconciliations carefully.
Certain litigation (benefits) charges, net are considered non-GAAP and comparable numbers are presented on an as if basis.
We believe that providing these non-GAAP financial measures in addition to the related GAAP measures provides investors with greater insight to the information used by HP's management in its financial and operational decision-making and allows investors to see HP's results "through the eyes" of management. We further believe that providing this information better enables investors to understand HP's operating performance and financial condition and to evaluate the efficacy of the methodology and information used by HP's management to evaluate and measure such performance and financial condition.
HP's Investor Relations website at https://investor.hp.com contains a significant amount of information about HP, including financial and other information for investors. HP encourages investors to visit its website from time to time, as information is updated and new information is posted.

Q4FY25 Highlights
- Net revenue of $14.6B, up 4% in nominal and constant currency¹ from the prior-year period
- Non-GAAP diluted net earnings per share² of $0.93, within the previously provided outlook of $0.87 to $0.97 per share
- GAAP diluted net earnings per share of $0.84, within the previously provided outlook of $0.75 - $0.85 per share
- Free cash flow of $1.5B²,³
- Returned $0.8B to shareholders in the form of share repurchases and dividends
- Adjusted to exclude the effect of foreign currency exchange fluctuations calculated by translating current period revenues using monthly exchange rates from the comparative period and excluding any hedging impact recognized in the current period
- A reconciliation of specific adjustments to GAAP results for the current and prior periods is included on slide 22 and in the GAAP to non-GAAP slides that appear as part of the supplemental slides of this presentation. A description of HP's use of non-GAAP information is provided on slide 3 under "Use of non-GAAP financial information"
- Free cash flow = Net cash provided by (used in) operating activities adjusted for net investment in leases from integrated financing and net investment in property, plant, equipment and purchased intangibles. See slide 29 for a reconciliation of Free Cash Flow
FY25 Highlights
- Net revenue of $55.3B, up 3% from the prior-year period and up 4% in constant currency¹
- Non-GAAP diluted net earnings per share² of $3.12
- GAAP diluted net earnings per share of $2.65
- Free cash flow of $2.9B²,³
- Returned $1.9B to shareholders in the form of dividends and share repurchases
- Adjusted to exclude the effect of foreign currency exchange fluctuations calculated by translating current period revenues using monthly exchange rates from the comparative period and excluding any hedging impact recognized in the current period
- A reconciliation of specific adjustments to GAAP results for the current and prior periods is included on slide 23 and in the GAAP to non-GAAP slides that appear as part of the supplemental slides of this presentation. A description of HP's use of non-GAAP information is provided on slide 3 under "Use of non-GAAP financial information"
- Free cash flow = Net cash provided by (used in) operating activities adjusted for net investment in leases from integrated financing and net investment in property, plant, equipment and purchased intangibles. See slide 29 for a reconciliation of Free Cash Flow

Q4 FY25 Mix by Segment and Region
Net revenue — By key segment and business unit¹
- Personal Systems Commercial: 48%
- Personal Systems Consumer: 23%
- Printing Supplies: 19%
- Printing Commercial: 8%
- Printing Consumer: 2%
- Personal Systems = 71% | Printing = 29%
- Total: $14.6 billion
Non-GAAP operating profit² — By key segment³
$1.4 billion
| Segment | Share of Total | OP Margin |
|---|---|---|
| Printing | 57% of total | 18.9% |
| Personal Systems | 43% of total | 5.8% |
Net revenue — By region
| Region | Share | y/y | y/y CC⁴ |
|---|---|---|---|
| AMERICAS | 42% | (0.6)% | (0.3)% |
| EMEA | 34% | 7.9% | 5.6% |
| APJ | 24% | 7.9% | 8.9% |
- US: 34% | Canada / LA: 8%
- Non-US net revenue = 66% of total net revenue
- Revenue mix calculated based on total key segment revenue, which does not include corporate investments and other
- A description of HP's use of non-GAAP information is provided on slide 3 under "Use of non-GAAP financial information"
- Operating profit mix calculated based on total key segment operating profit, which does not include corporate investments and other
- CC = constant currency; adjusted to exclude the effect of foreign currency exchange fluctuations calculated by translating current period revenues using monthly exchange rates from the comparative period and excluding any hedging impact recognized in the current periods

FY25 Mix by Segment and Region
Net revenue — By key segment and business unit¹
- Personal Systems Commercial: 50%
- Personal Systems Consumer: 20%
- Printing Supplies: 20%
- Printing Commercial: 8%
- Printing Consumer: 2%
- Personal Systems = 70% | Printing = 30%
- Total: $55.3 billion
Non-GAAP operating profit² — By key segment³
$5.2 billion
| Segment | Share of Total | OP Margin |
|---|---|---|
| Printing | 60% of total | 18.7% |
| Personal Systems | 40% of total | 5.3% |
Net revenue — By region
| Region | Share | y/y | y/y CC⁴ |
|---|---|---|---|
| AMERICAS | 42% | 1.3% | 2.1% |
| EMEA | 34% | 3.1% | 2.6% |
| APJ | 24% | 7.3% | 8.5% |
- US: 35% | Canada / LA: 7%
- Non-US net revenue = 65% of total net revenue
- Revenue mix calculated based on total key segment revenue, which does not include corporate investments and other
- A description of HP's use of non-GAAP information is provided on slide 3 under "Use of non-GAAP financial information"
- Operating profit mix calculated based on total key segment operating profit, which does not include corporate investments and other
- CC = constant currency; adjusted to exclude the effect of foreign currency exchange fluctuations calculated by translating current period revenues using monthly exchange rates from the comparative period and excluding any hedging impact recognized in the current periods

Q4 FY25 Results Overview
| $ in millions | Net revenue | Growth y/y % | Growth CC¹ y/y % | Non-GAAP OP $³ | Non-GAAP OP % of rev³ | Non-GAAP OP $ y/y³ | Non-GAAP OP % of rev y/y³ |
|---|---|---|---|---|---|---|---|
| Printing | $4,266 | (4.2)% | (4.1)% | $805 | 18.9% | $(69) | (0.7) pts |
| Personal Systems | $10,353 | 7.9% | 7.4% | $597 | 5.8% | $6 | (0.4) pts |
| Corporate Investments / Other | $20 | nm² | nm² | $(233) | nm² | $(8) | nm² |
| Total HP | $14,639 | 4.2% | 3.8% | $1,169 | 8.0% | $(71) | (0.8) pts |
- CC = constant currency; adjusted to exclude the effect of foreign currency exchange fluctuations calculated by translating current period revenues using monthly average exchange rates from the comparative period and excluding any hedging impact recognized in the current period
- Not meaningful
- A reconciliation of specific adjustments to GAAP results for the current period is included on slide 22 and in the GAAP to non-GAAP slides that appear as part of the supplemental slides of this presentation. A description of HP's use of non-GAAP information is provided on slide 3 under "Use of non-GAAP financial information"
FY25 Results Overview
| $ in millions | Net revenue | Growth y/y % | Growth CC¹ y/y % | Non-GAAP OP $³ | Non-GAAP OP % of rev³ | Non-GAAP OP $ y/y³ | Non-GAAP OP % of rev y/y³ |
|---|---|---|---|---|---|---|---|
| Printing | $16,702 | (3.7)% | (2.7)% | $3,118 | 18.7% | $(172) | (0.3) pts |
| Personal Systems | $38,532 | 6.5% | 6.7% | $2,054 | 5.3% | $(199) | (0.9) pts |
| Corporate Investments / Other | $61 | nm² | nm² | $(1,063) | nm² | $(98) | nm² |
| Total HP | $55,295 | 3.2% | 3.7% | $4,109 | 7.4% | $(469) | (1.1) pts |
- CC = constant currency; adjusted to exclude the effect of foreign currency exchange fluctuations calculated by translating current period revenues using monthly average exchange rates from the comparative period and excluding any hedging impact recognized in the current period
- Not meaningful
- A reconciliation of specific adjustments to GAAP results for the current period is included on slide 23 and in the GAAP to non-GAAP slides that appear as part of the supplemental slides of this presentation. A description of HP's use of non-GAAP information is provided on slide 3 under "Use of non-GAAP financial information"
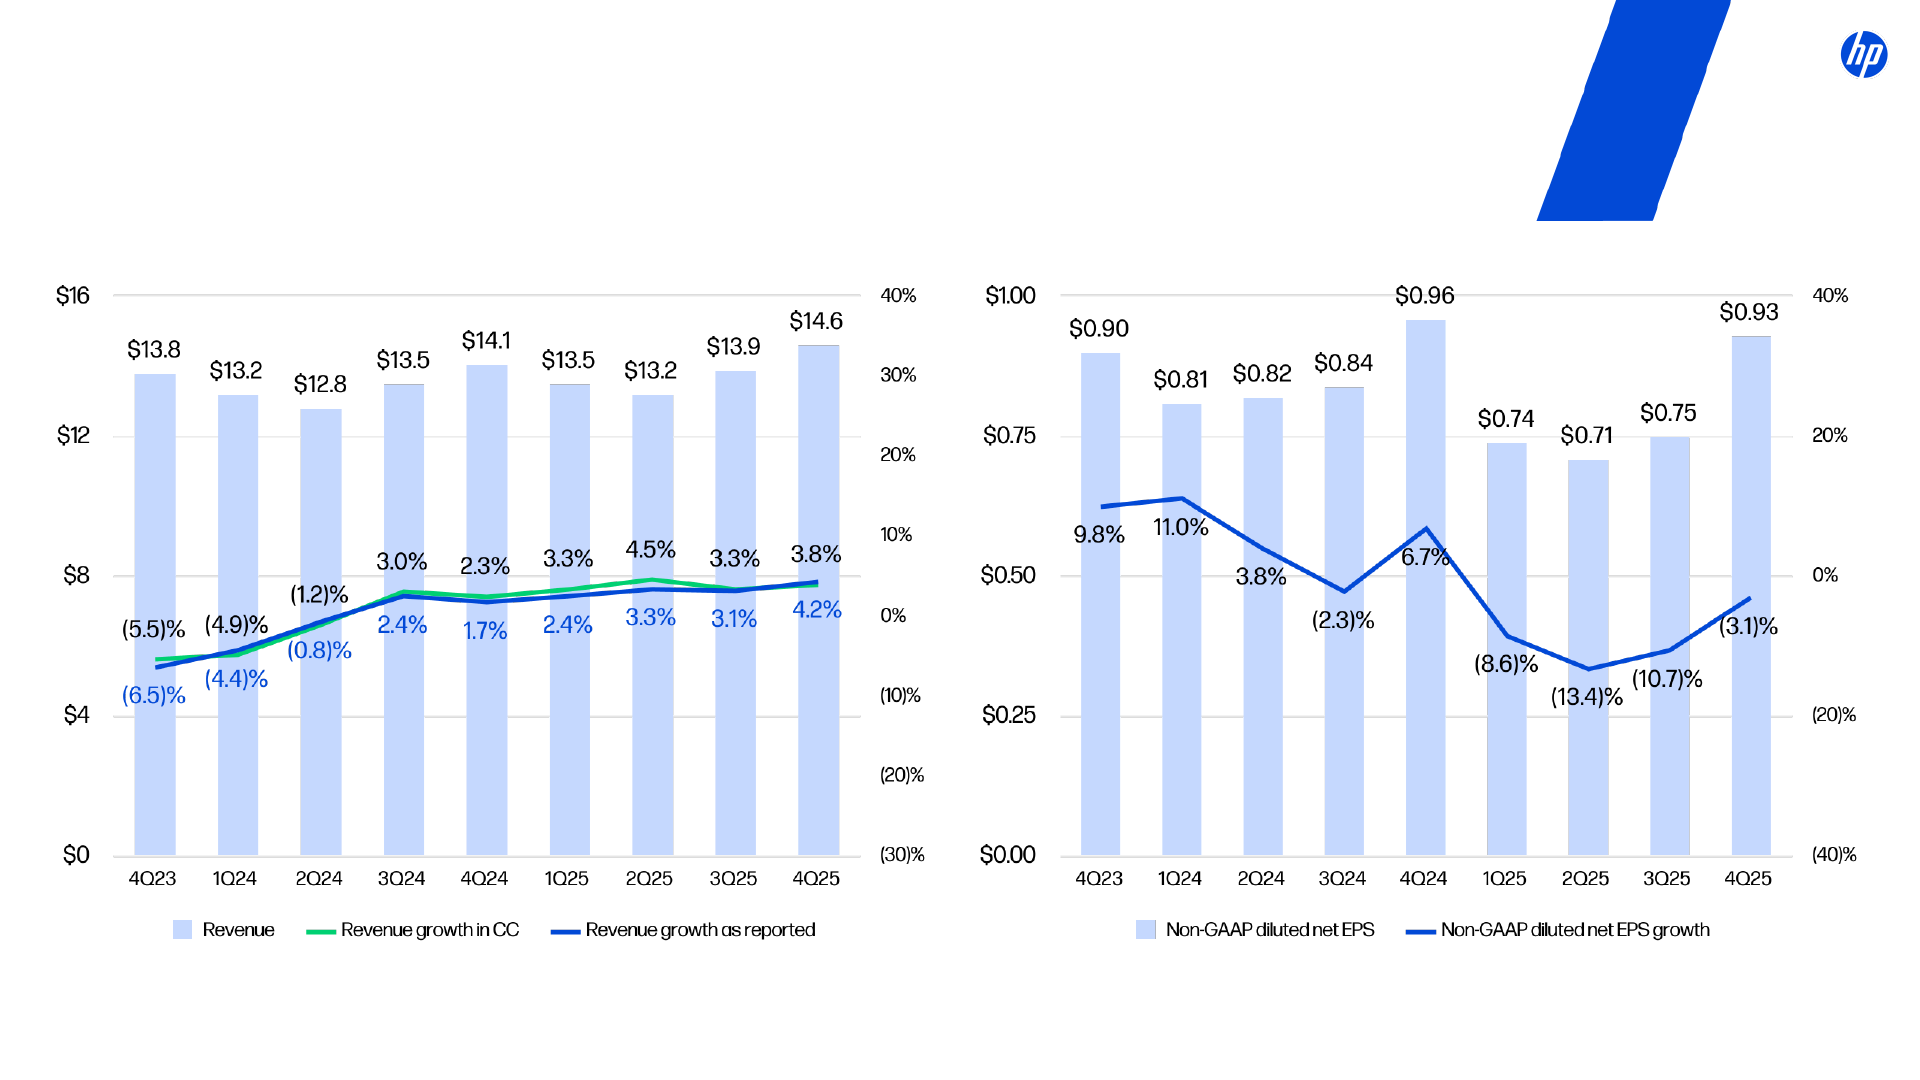
Revenue & Non-GAAP Diluted Net EPS
- CC = constant currency; adjusted to exclude the effect of foreign currency exchange fluctuations calculated by translating current period revenue using monthly exchange rates from the comparative period and excluding any hedging impact recognized in the current period
- A reconciliation of specific adjustments to GAAP results for the current period is included on slide 22 and in the GAAP to non-GAAP slides that appear as part of the supplemental slides of this presentation. A description of HP's use of non-GAAP information is provided on slide 3 under "Use of non-GAAP financial information"
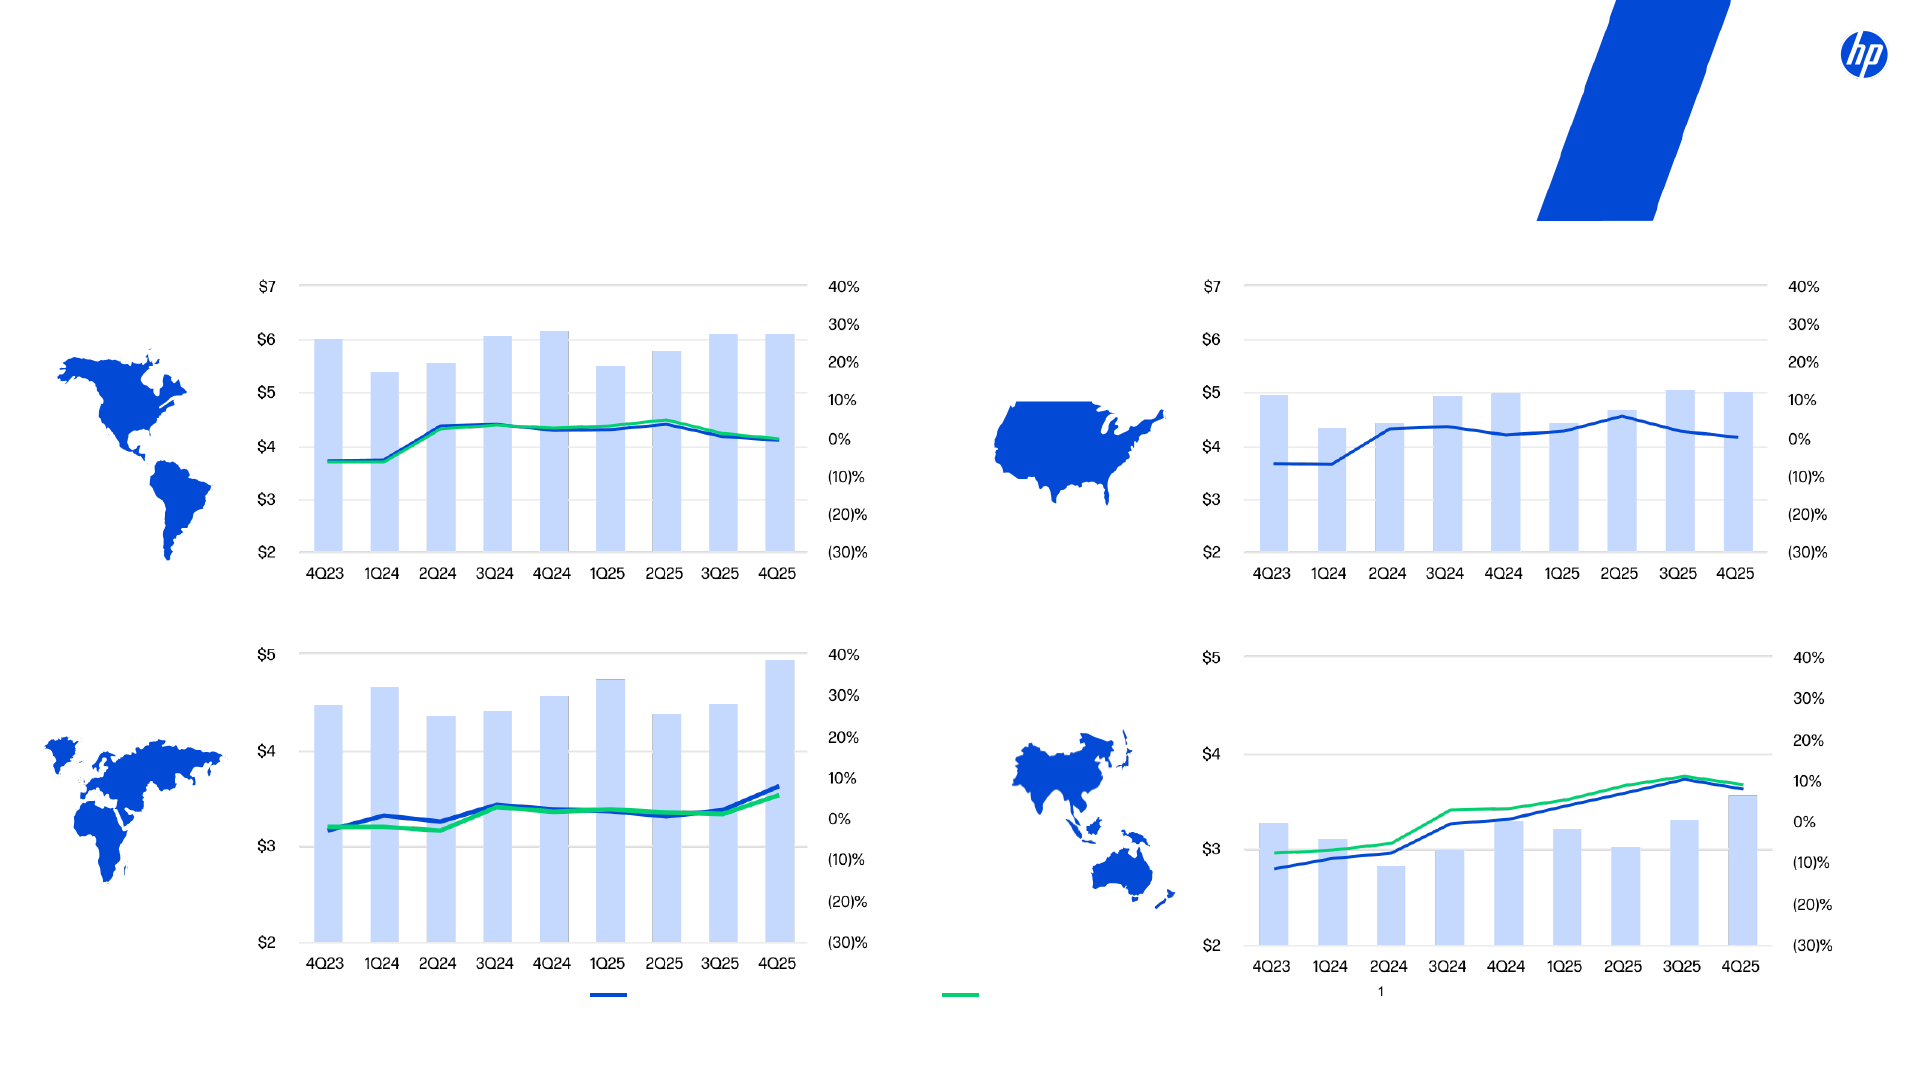
Regional Revenue Trend
- Adjusted to exclude the effect of foreign currency exchange fluctuations calculated by translating current period revenues using monthly exchange rates from the comparative period and excluding any hedging impact recognized in the current period
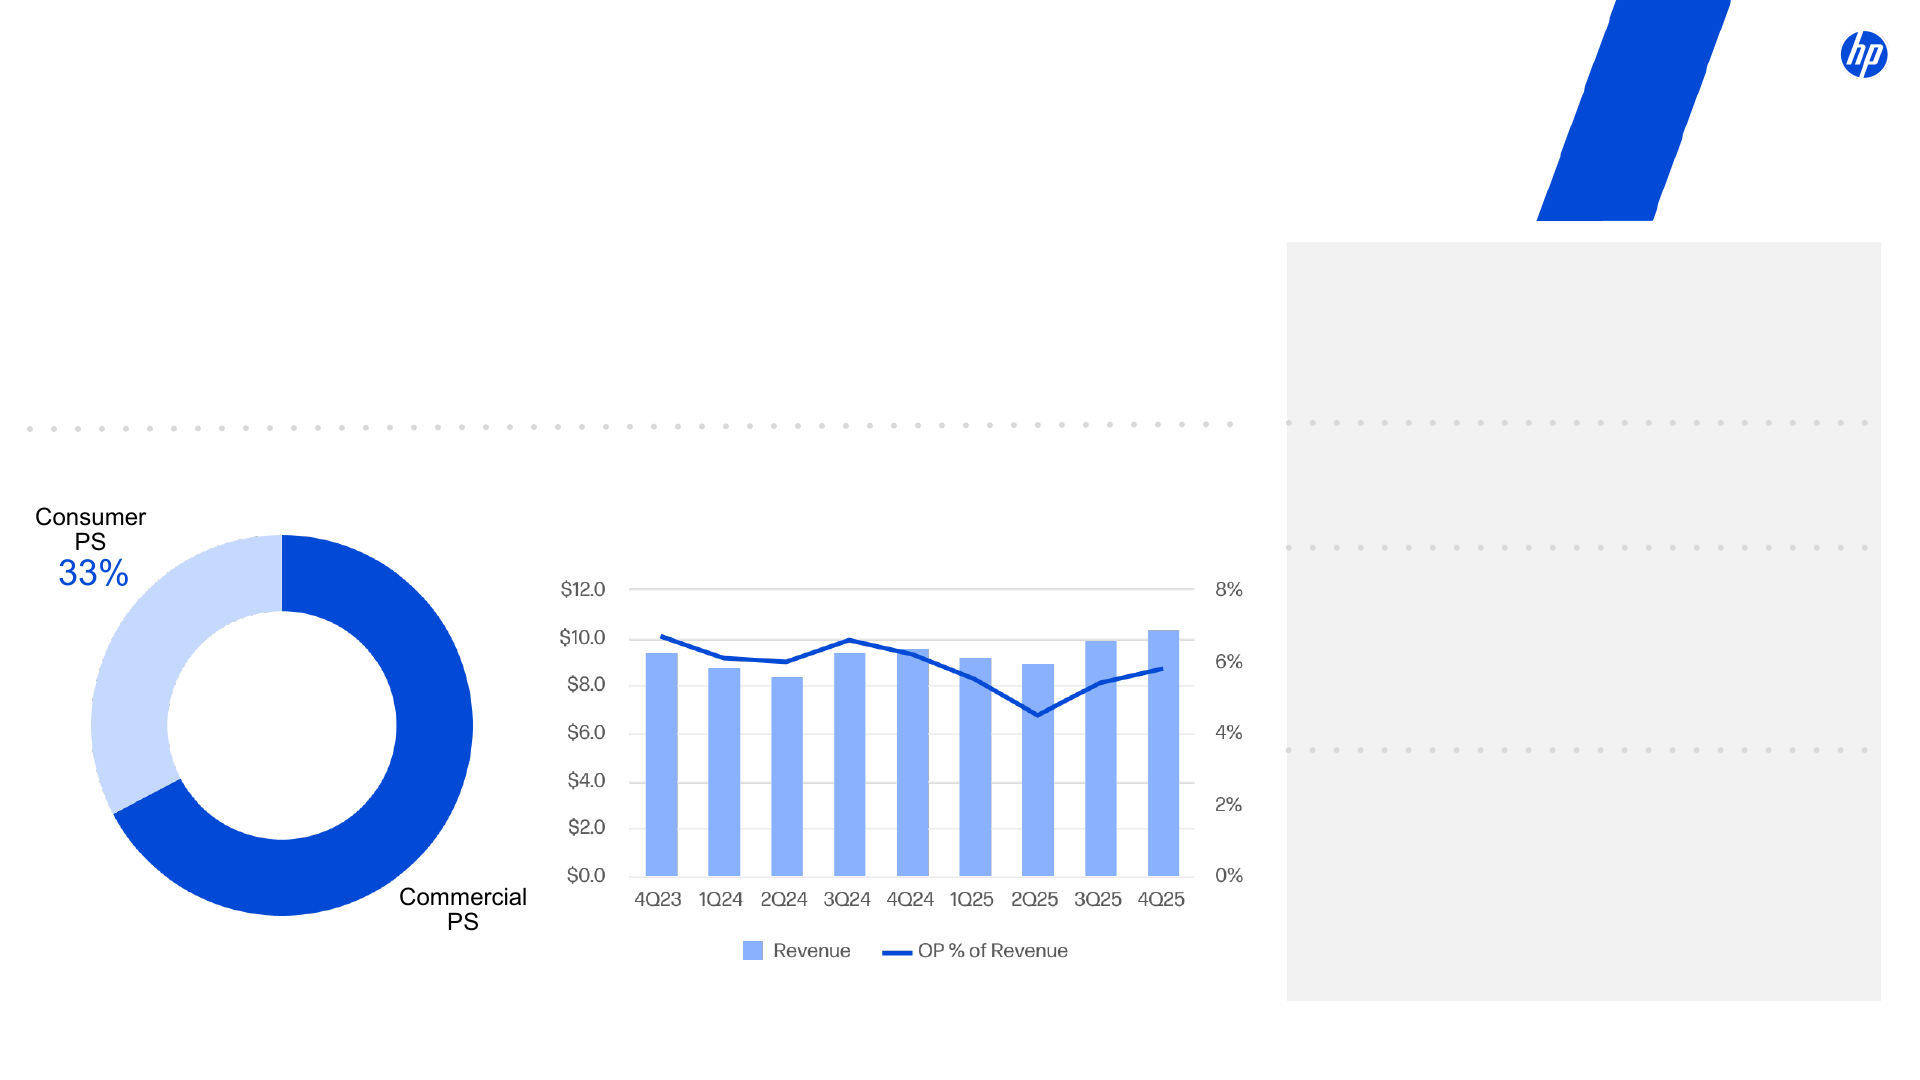
Personal Systems Q4 FY25
Revenue
$10.4 billion | 8% y/y | 7% y/y CC¹
Operating profit
$597 million | 5.8% of revenue
Revenue breakdown
- Commercial PS: 67%
- Consumer PS: 33%
Revenue up for the 7th consecutive quarter driven by strength in commercial and consumer, increased ASPs, and momentum in the Key Growth Areas.
OP rate at 5.8% up 0.4 pts q/q primarily due to pricing discipline and cost mitigation.
Launched AI station, a new class of edge devices, which delivers 1,000 TOPS for AI workloads at the edge. Introduced industry's first 49-inch ultrawide monitor which integrates AI noise reduction.
Key Metrics
- Total units up 7% y/y
- Commercial PS units up 7% y/y
- Consumer PS units up 8% y/y
- Commercial PS revenue up 7% y/y
- Consumer PS revenue up 10% y/y
- CC = constant currency; adjusted to exclude the effect of foreign currency exchange fluctuations calculated by translating current period revenue using monthly exchange rates from the comparative period and excluding any hedging impact recognized in the current period
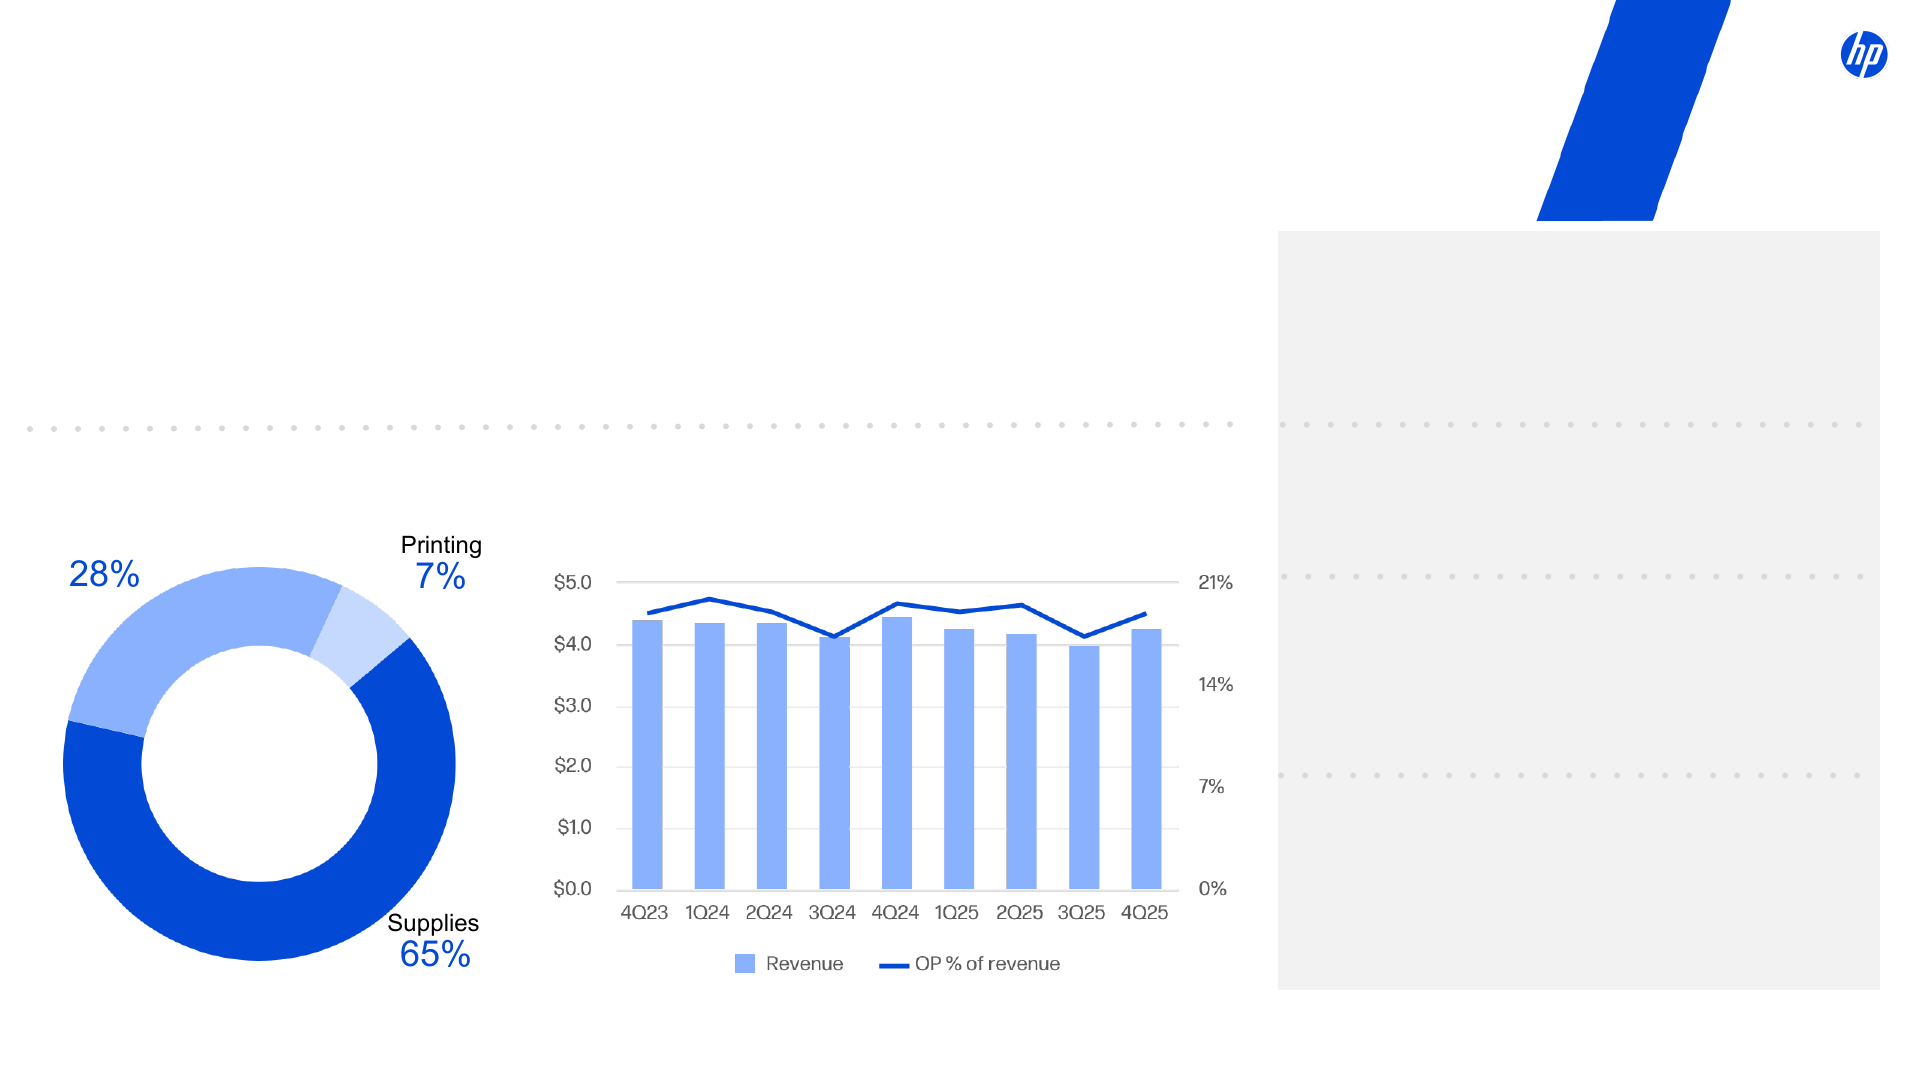
Printing Q4 FY25
Revenue
$4.3 billion | (4)% y/y | (4)% y/y CC¹
Operating profit
$805 million | 18.9% of revenue
Revenue breakdown
- Supplies: 65%
- Commercial Printing: 28%
- Consumer Printing: 7%
Revenue up 7% q/q driven by higher hardware and supplies volumes, strategic pricing actions, and sustained momentum in the Key Growth Areas.
OP rate of 18.9%, up 1.6 pts q/q driven by supplies volumes, pricing and cost actions, which were offset in part by trade related expenses.
Launched HPs first at-home AI print App in US for 'perfectly formatted prints every time'. Launched the Indigo 6K+ Digital Press offering versatility and productivity in digital label production.
Key Metrics
- Supplies revenue down 4% y/y (down 3% in CC¹)
- Total Hardware units down 12% y/y
- Consumer Printing revenue down 9% y/y
- Commercial Printing revenue down 4% y/y
- CC = constant currency; adjusted to exclude the effect of foreign currency exchange fluctuations calculated by translating current period revenue using monthly exchange rates from the comparative period and excluding any hedging impact recognized in the current period

Key Growth Areas
Collectively revenue grew double digits y/y Gross margin above core business
AI PC
Maintained strong momentum with double digit revenue growth y/y and q/q. AI PCs unit now above 30% of PC mix. HP leading and partnering with hundreds of ISVs to develop on-device AI applications running workloads at the edge.
Consumer Subscriptions
Consumer Subscription revenue grew double digit y/y driven by strong performance in Instant Ink, Instant Paper and the All-in Plan.
Advanced Compute Solutions
Double digit revenue growth in FY25 fueled by strong performance in Data Science workstations, share gains and mix. Introduced a new edge class device, in a compact form factor and able to run advanced models from Mixtral and Ollama locally, accelerating development and reducing cloud costs.
Industrial Graphics & 3D
Record quarter powered by Labels & Packaging demand growth, expansion of services and solutions, and strengthened market leadership. 3D hardware and supplies show strong growth, especially in the drone and robotics manufacturing.
Hybrid Systems
Introduced an expanded lineup with peripheral devices delivering superior comfort for high-performance workflows. Poly Studio room systems are now deployed in over 12% of meeting rooms, and with over 12 million IT managed devices for hybrid work in enterprises worldwide.
Workforce Solutions
Revenue grew double-digit y/y and q/q driven by increases in both hardware and services. Workforce Experience Platform (WXP) now manages ~2.4M connected devices, captures telemetry from 48M endpoints, remediates 12M IT issues per month.

Q4 FY25 Sustainable Impact
Empower Customer Sustainability
- Award: Frost & Sullivan 2025 Americas Company of the Year for leadership in sustainability, circular business practices and customer-focused innovation.
- Award: HP Renew Solutions awarded the Original Equipment Manufacturer (OEM) Circular Innovation Award at 2025 IT Asset Disposition Summit.
Transform HP's Value Chain
- Achievement: Empowered 1K people in Bangladesh and the Philippines through legal and rights-based training with Asia Indigenous Peoples Pact and United Nations Development Program.
- Achievement: Diverted 53K tonnes of ocean-bound plastics (OBP) — twice the original goal – concluding HP's participation in the NextWave Plastics consortium.
Advance Societal Impact
- New Partnership: Future Worker Accelerator Alumni.
- i. Access to Success (Canada): Empowering people with disabilities through future-of-work training.
- ii. eSTEM (Morocco): Expanding AI literacy and workforce readiness with a target to reach 100K adolescent learners.
- New Initiative: HP Gaming Garage launched a 5th course on Blockchain & Cybersecurity, reaching 200+ learners to date.
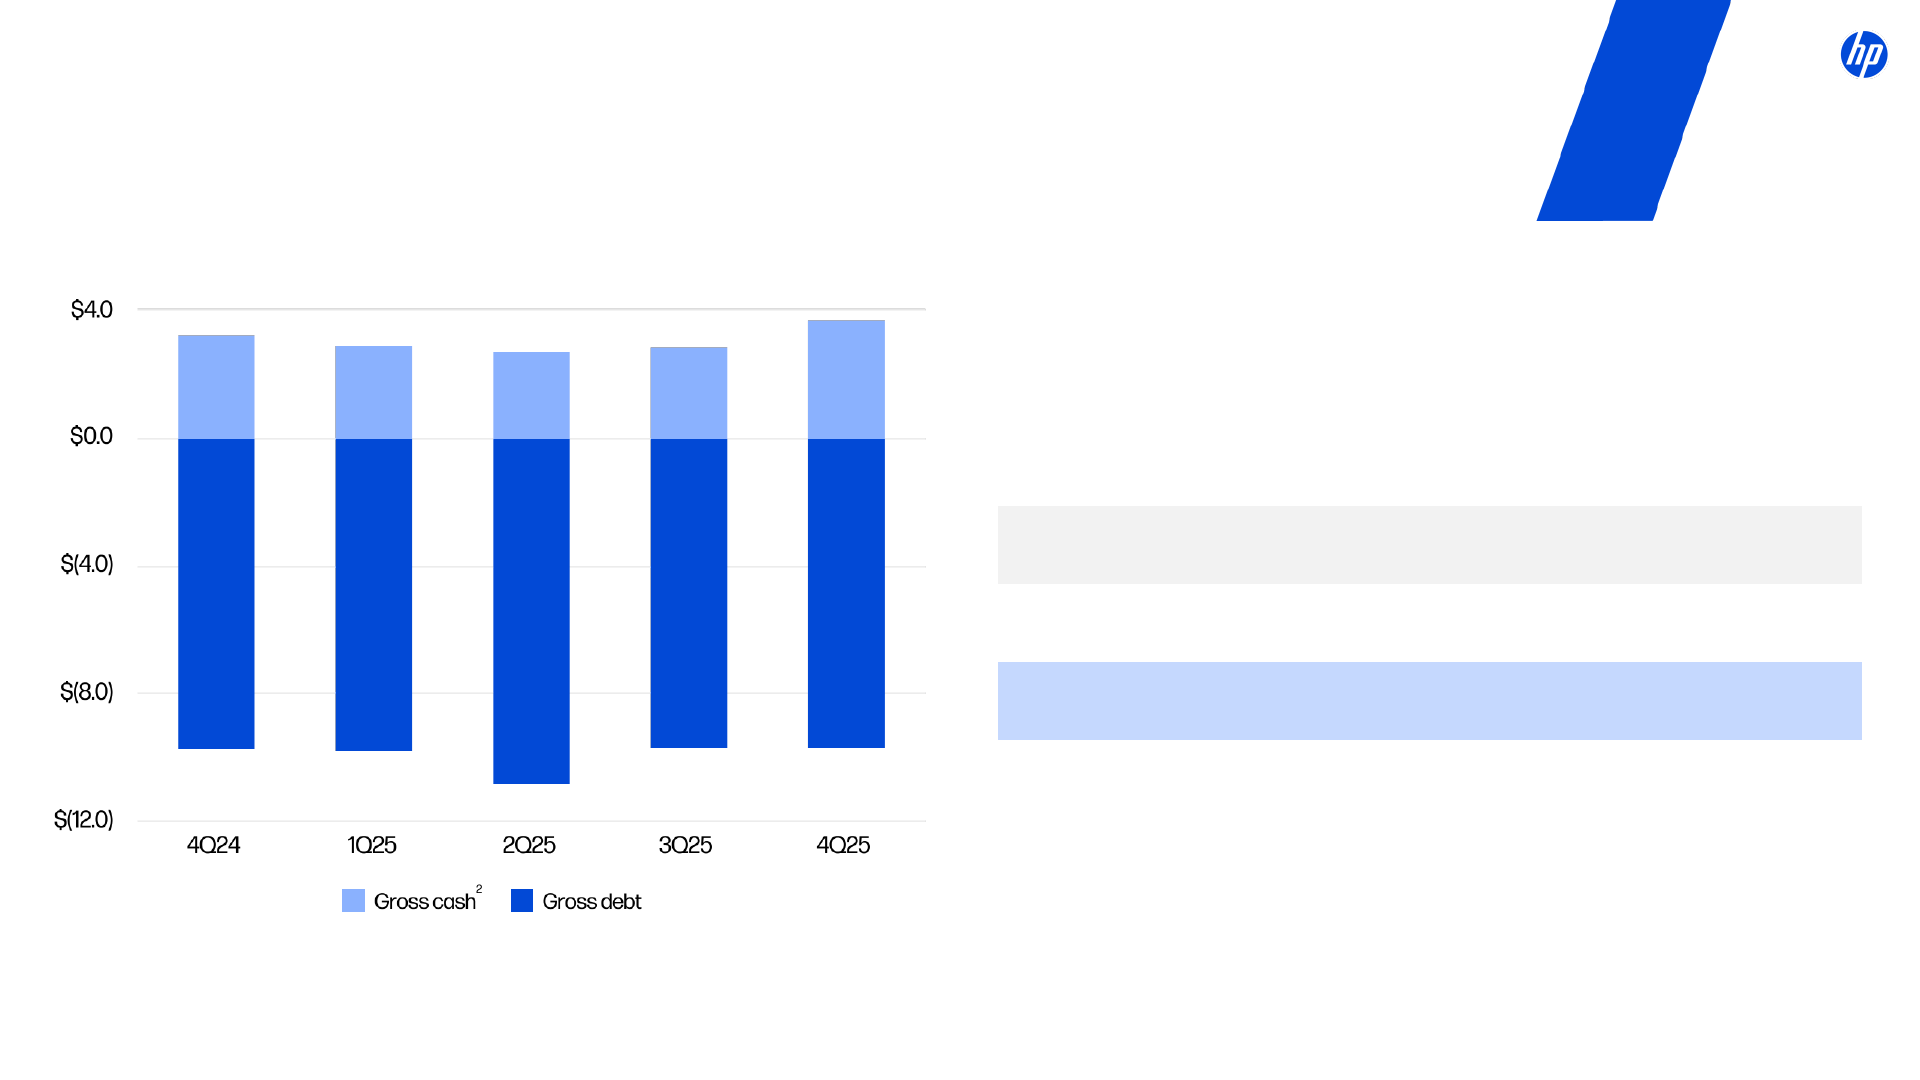
Select Cash & Debt Balances
| $ Billions | 4Q24 | 1Q25 | 2Q25 | 3Q25 | 4Q25 |
|---|---|---|---|---|---|
| Gross cash² | 3.3 | 2.9 | 2.7 | 2.9 | 3.7 |
| Gross debt³ | 9.7 | 9.8 | 10.8 | 9.7 | 9.7 |
| Net cash (debt)¹,⁴ | (6.5) | (6.9) | (8.1) | (6.8) | (6.0) |
- Net cash (debt) is defined as gross cash less gross debt
- Gross cash includes cash, cash equivalents and restricted cash, short-term investments, and certain liquid long-term investments. As of 4Q25, gross cash includes cash and cash equivalents of $3.7 billion, restricted cash of $15 million related to amounts collected and held on behalf of a third party for trade receivables previously sold, cash held for sale $8 million, and short-term investments of $3 million included in other current assets
- Gross debt is defined as notes payable and short-term borrowings plus long-term debt after excluding the effect of unamortized premium/discount on debt issuance, debt issuance costs and gains/losses on interest rate swaps. As of 4Q25, gross debt included notes payable and short-term borrowings of $0.8 billion, long-term debt of $8.8 billion, and an adjustment for the aforementioned non-cash items of $57 million
- Numbers may not foot due to rounding
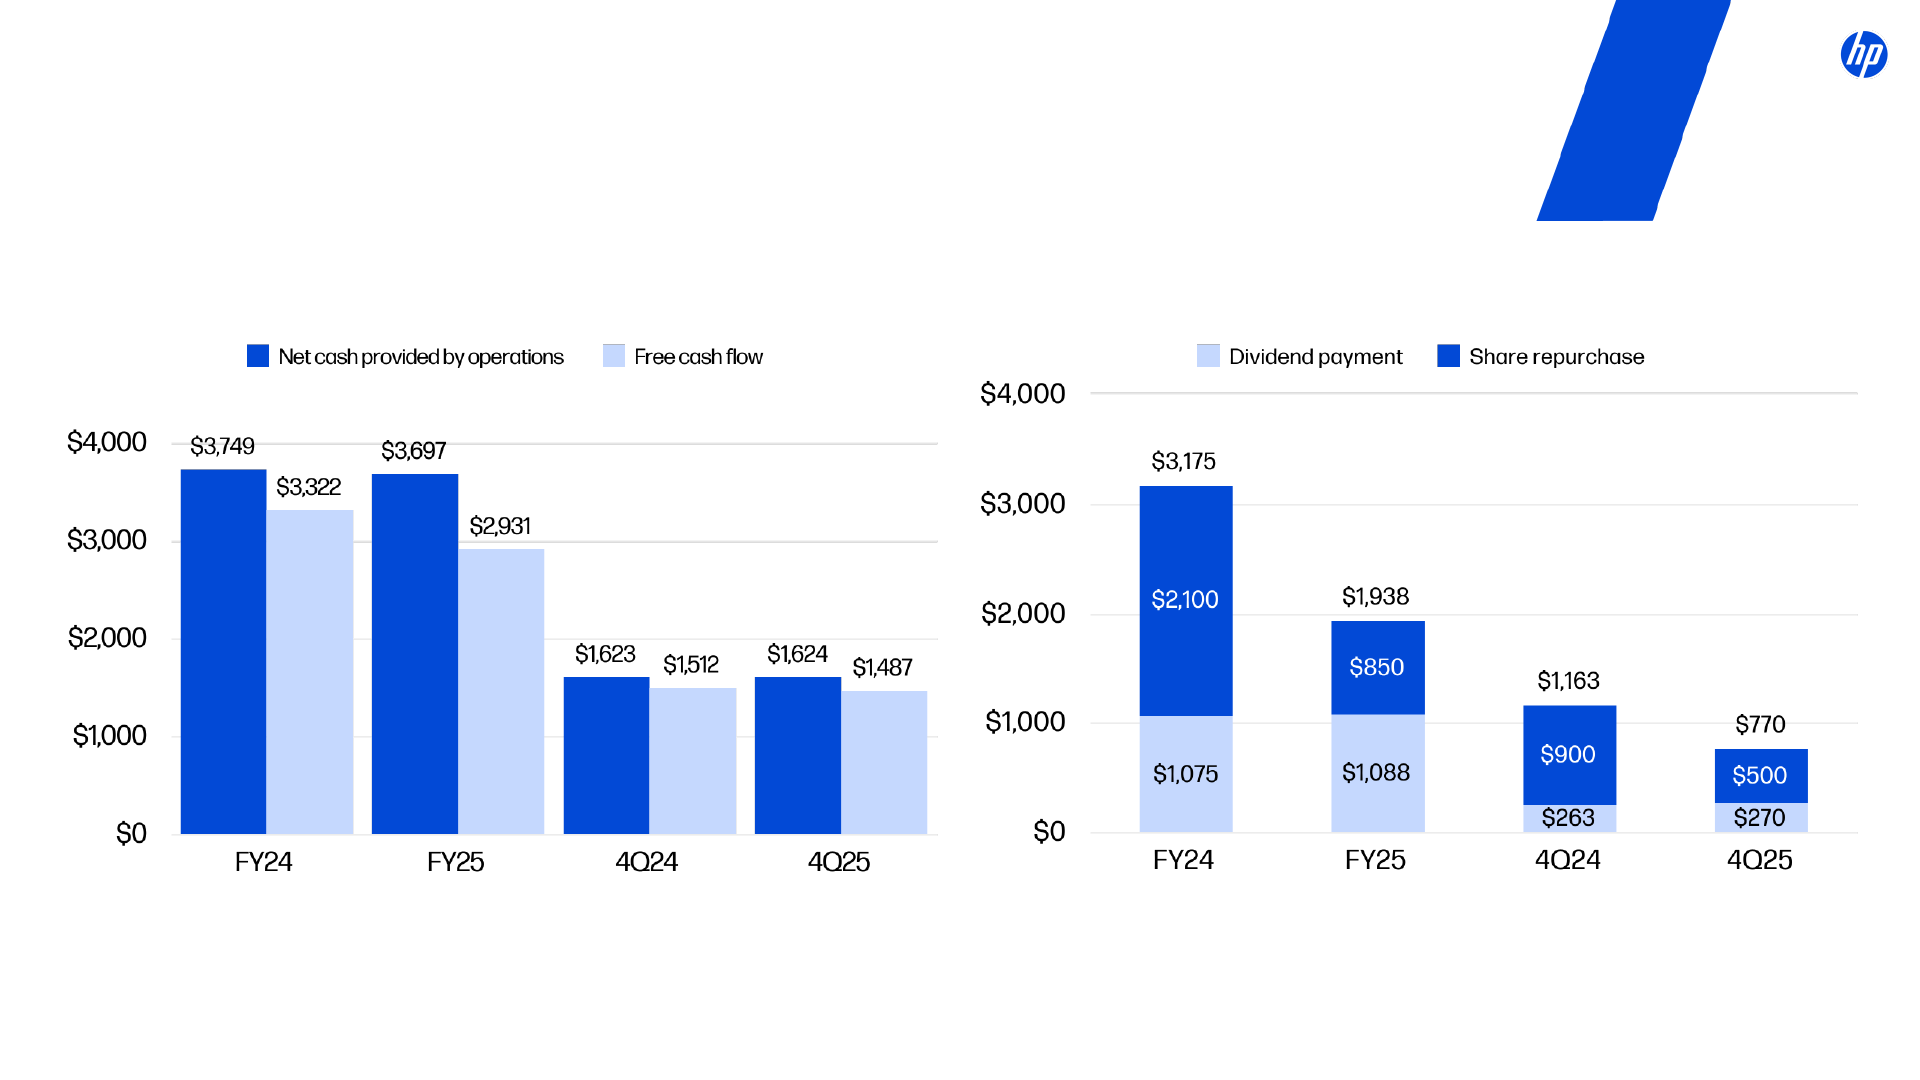
Cash Flow & Shareholder Return
Cash Flow ($ Millions)
| Period | Net cash provided by operations | Free cash flow¹ |
|---|---|---|
| FY24 | $3,749 | $3,322 |
| FY25 | $3,697 | $2,931 |
| 4Q24 | $1,623 | $1,512 |
| 4Q25 | $1,624 | $1,487 |
Shareholder Return ($ Millions)
| Period | Share repurchase | Dividend payment | Total |
|---|---|---|---|
| FY24 | $2,100 | $1,075 | $3,175 |
| FY25 | $850 | $1,088 | $1,938 |
| 4Q24 | $900 | $263 | $1,163 |
| 4Q25 | $500 | $270 | $770 |
| FY24 | FY25 | 4Q24 | 4Q25 | |
|---|---|---|---|---|
| Shares repurchased | 62.7 million | 29.5 million | 25.4 million | 18.3 million |
| Dividend per share | $1.10 | $1.16 | $0.28 | $0.29 |
- Free cash flow = Net cash provided by (used in) operating activities adjusted for net investment in leases from integrated financing and net investment in property, plant, equipment and purchased intangibles. See slide 29 for a reconciliation of Free Cash Flow
Completed Future Ready Transformation Program
Exceeded original savings target by ~$800M, mitigating Macroeconomic headwinds
| Original Plan | Revised commitment | Final Results | ||
|---|---|---|---|---|
| November '22 | October '23 | January '25 | October '25 | |
| Gross Annualized Run Rate Savings | >$1.4B | $1.6B | $1.9B | $2.2B |
| Restructuring & Other Charges | ~$1.0B | $1.0B | $1.2B | $1.2B |
| Headcount Impact | 4-6k | ~7k | 8-9k | 9.4k |

Launching a Company-wide Initiative
Leveraging AI across our operations to deliver profitable growth
Gross Run Rate Savings: ~$1B by the end of FY28
| Area | Description | Share of Savings |
|---|---|---|
| Product Development | Increase software development scale and accelerate innovation time to market while delivering growth from new AI solutions experiences | ~20% |
| Customer Experience | More efficient services delivery, improved customer support, and accelerated sales management while growing our solutions capability | ~40% |
| Operational Excellence | AI adoption and enablement to drive productivity across our technology infrastructure, supply chain and operational processes while managing resilience | ~40% |
Restructuring & Other Charges: ~$0.65B
Headcount Impact: 4 – 6k

Outlook
FY26 Key Assumptions
- Revenue: Grow faster than market
- EPS: Memory cost impact of $0.30 mostly in 2H FY26
- Non-GAAP OI&E¹,³: ~($0.6B)
- Corporate Other: ~$1B
FY26 Outlook
| Metric | Range |
|---|---|
| GAAP diluted net EPS | $2.47 – $2.77 |
| Non-GAAP diluted net EPS¹,² | $2.90 – $3.20 |
| Free cash flow¹,⁴ | $2.8 – $3.0B |
Q1'26 Outlook
| Metric | Range |
|---|---|
| GAAP diluted net EPS | $0.58 - $0.66 |
| Non-GAAP diluted net EPS¹,² | $0.73 – $0.81 |
- A description of HP's use of non-GAAP information is provided on slide 3 under "Use of non-GAAP financial information"
- First quarter and fiscal 2025 non-GAAP diluted net EPS estimates exclude restructuring and other charges, acquisition and divestiture charges, amortization of intangible assets, non-operating retirement-related credits, tax adjustments, and the related tax impact on these items
- Fiscal 2025 non-GAAP OI&E estimates exclude non-operating retirement-related credits and the related tax impact
- Free cash flow = Net cash provided by operating activities adjusted for net investment in leases from integrated financing and net investment in property, plant and equipment and purchased intangibles
Non-GAAP¹ Financial Information
$ in millions, except per share amounts
| Q4 FY25 | Q3 FY25 | Q4 FY24 | ||||
|---|---|---|---|---|---|---|
| % of Revenue | % of Revenue | % of Revenue | ||||
| Revenue | $14,639 | $13,932 | $14,055 | |||
| Cost of revenue | 11,677 | 79.8% | 11,081 | 79.5% | 11,054 | 78.6% |
| Total OpEx | 1,793 | 12.2% | 1,856 | 13.4% | 1,761 | 12.6% |
| Operating profit | $1,169 | 8.0% | $995 | 7.1% | $1,240 | 8.8% |
| Interest and other, net | (125) | (146) | (128) | |||
| Pre-tax earnings | 1,044 | 7.1% | 849 | 6.1% | 1,112 | 7.9% |
| Income tax | (167) | (136) | (178) | |||
| Net earnings | $877 | 6.0% | $713 | 5.1% | $934 | 6.6% |
| Diluted net earnings per share | $0.93 | $0.75 | $0.96 |
- A reconciliation of specific adjustments to GAAP results for the current period is included on slides 22 and in the GAAP to non-GAAP slides that appear as part of the supplemental slides of this presentation. A description of HP's use of non-GAAP information is provided on slide 3 under "Use of non-GAAP financial information"

Q4 FY25 GAAP to Non-GAAP Bridge
$ in millions, except tax rate and per share amounts
| GAAP | Amortization of intangible assets | Restructuring and other charges | Acquisition and divestiture charges | Certain litigation charges, net | Tax adjustments | Non-GAAP | |
|---|---|---|---|---|---|---|---|
| Revenue | $14,639 | $14,639 | |||||
| Cost of revenue | 11,677 | 11,677 | |||||
| Total OpEx | 2,003 | (58) | (103) | (14) | (35) | 1,793 | |
| Operating profit | 959 | 58 | 103 | 14 | 35 | 1,169 | |
| Interest and other, net | (125) | (125) | |||||
| Pre-tax earnings | 834 | 58 | 103 | 14 | 35 | 1,044 | |
| Income tax | (39) | (12) | (22) | (2) | (6) | (86) | (167) |
| Tax rate | 4.7% | 16.0% | |||||
| Net earnings | $795 | 46 | 81 | 12 | 29 | (86) | $877 |
| Diluted net earnings per share | $0.84 | $0.05 | $0.09 | $0.01 | $0.03 | $(0.09) | $0.93 |
A description of HP's use of non-GAAP information is provided on slide 3 under "Use of non-GAAP financial information"

FY25 GAAP to Non-GAAP Bridge
$ in millions, except tax rate and per share amounts
| GAAP | Amortization of intangible assets | Restructuring and other charges | Acquisition and divestiture charges | Certain litigation charges (benefits), net | Non-operating retirement related (credits) / charges | Tax adjustments | Non-GAAP | |
|---|---|---|---|---|---|---|---|---|
| Revenue | $55,295 | $55,295 | ||||||
| Cost of revenue | 43,903 | 43,903 | ||||||
| Total OpEx | 8,218 | (345) | (405) | (45) | (140) | 7,283 | ||
| Operating profit | 3,174 | 345 | 405 | 45 | 140 | 4,109 | ||
| Interest and other, net | (506) | (52) | (13) | (571) | ||||
| Pre-tax earnings | 2,668 | 345 | 405 | 45 | 88 | (13) | 3,538 | |
| Income tax | (139) | (63) | (80) | (6) | (16) | 5 | (267) | (566) |
| Tax rate | 5.2% | 16.0% | ||||||
| Net earnings | 2,529 | 282 | 325 | 39 | 72 | (8) | (267) | $2,972 |
| Diluted net earnings per share | $2.65 | $0.30 | $0.34 | $0.04 | $0.08 | $(0.01) | $(0.28) | $3.12 |
A description of HP's use of non-GAAP information is provided on slide 3 under "Use of non-GAAP financial information"


Supplemental Slides
Inventory & Accounts Receivable
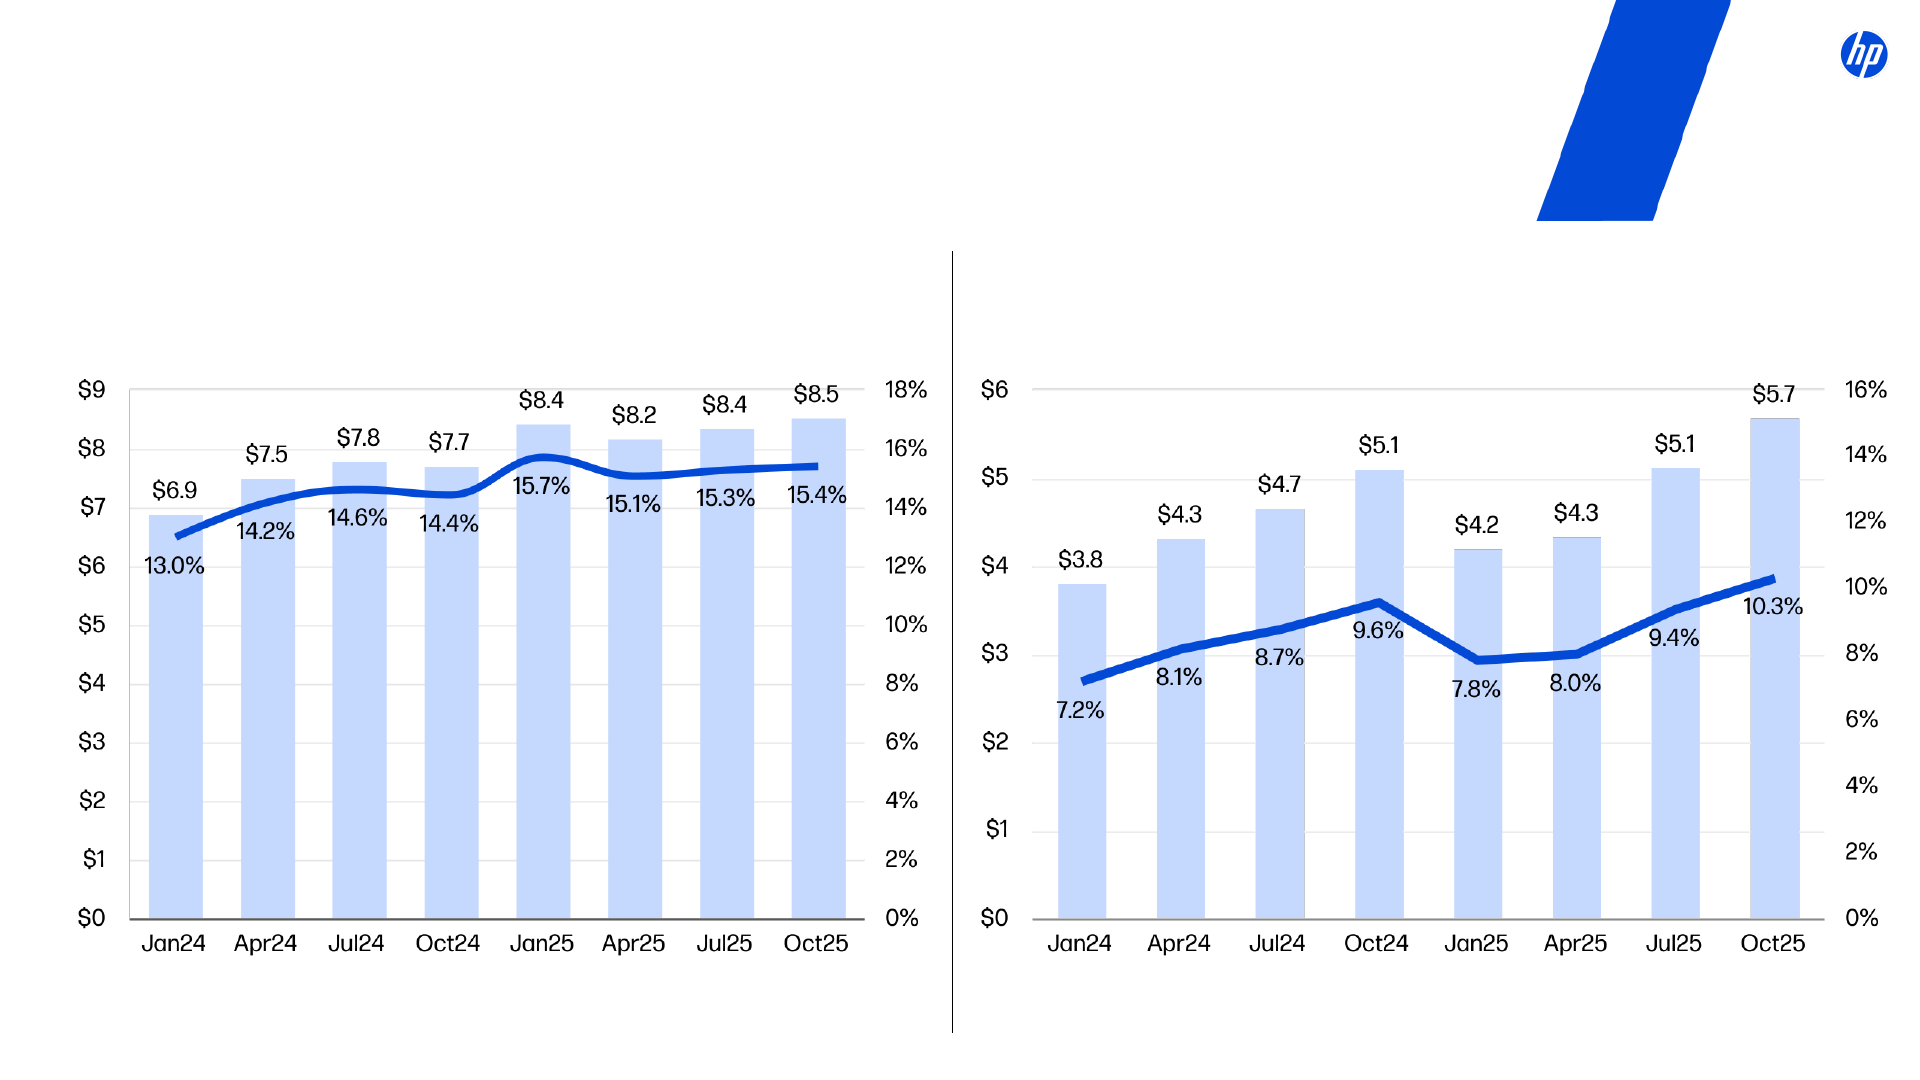
Inventory (In Billions / Percentage of Revenue¹)
| Period | $ Billions | % of Revenue |
|---|---|---|
| Jan24 | $6.9 | 13.0% |
| Apr24 | $7.5 | 14.2% |
| Jul24 | $7.8 | 14.6% |
| Oct24 | $7.7 | 14.4% |
| Jan25 | $8.4 | 15.7% |
| Apr25 | $8.2 | 15.1% |
| Jul25 | $8.4 | 15.3% |
| Oct25 | $8.5 | 15.4% |
Accounts Receivable (In Billions / Percentage of Revenue¹)
| Period | $ Billions | % of Revenue |
|---|---|---|
| Jan24 | $3.8 | 7.2% |
| Apr24 | $4.3 | 8.1% |
| Jul24 | $4.7 | 8.7% |
| Oct24 | $5.1 | 9.6% |
| Jan25 | $4.2 | 7.8% |
| Apr25 | $4.3 | 8.0% |
| Jul25 | $5.1 | 9.4% |
| Oct25 | $5.7 | 10.3% |
- % of revenue calculations based on trailing 4-quarter net revenue
PP&E & Accounts Payable
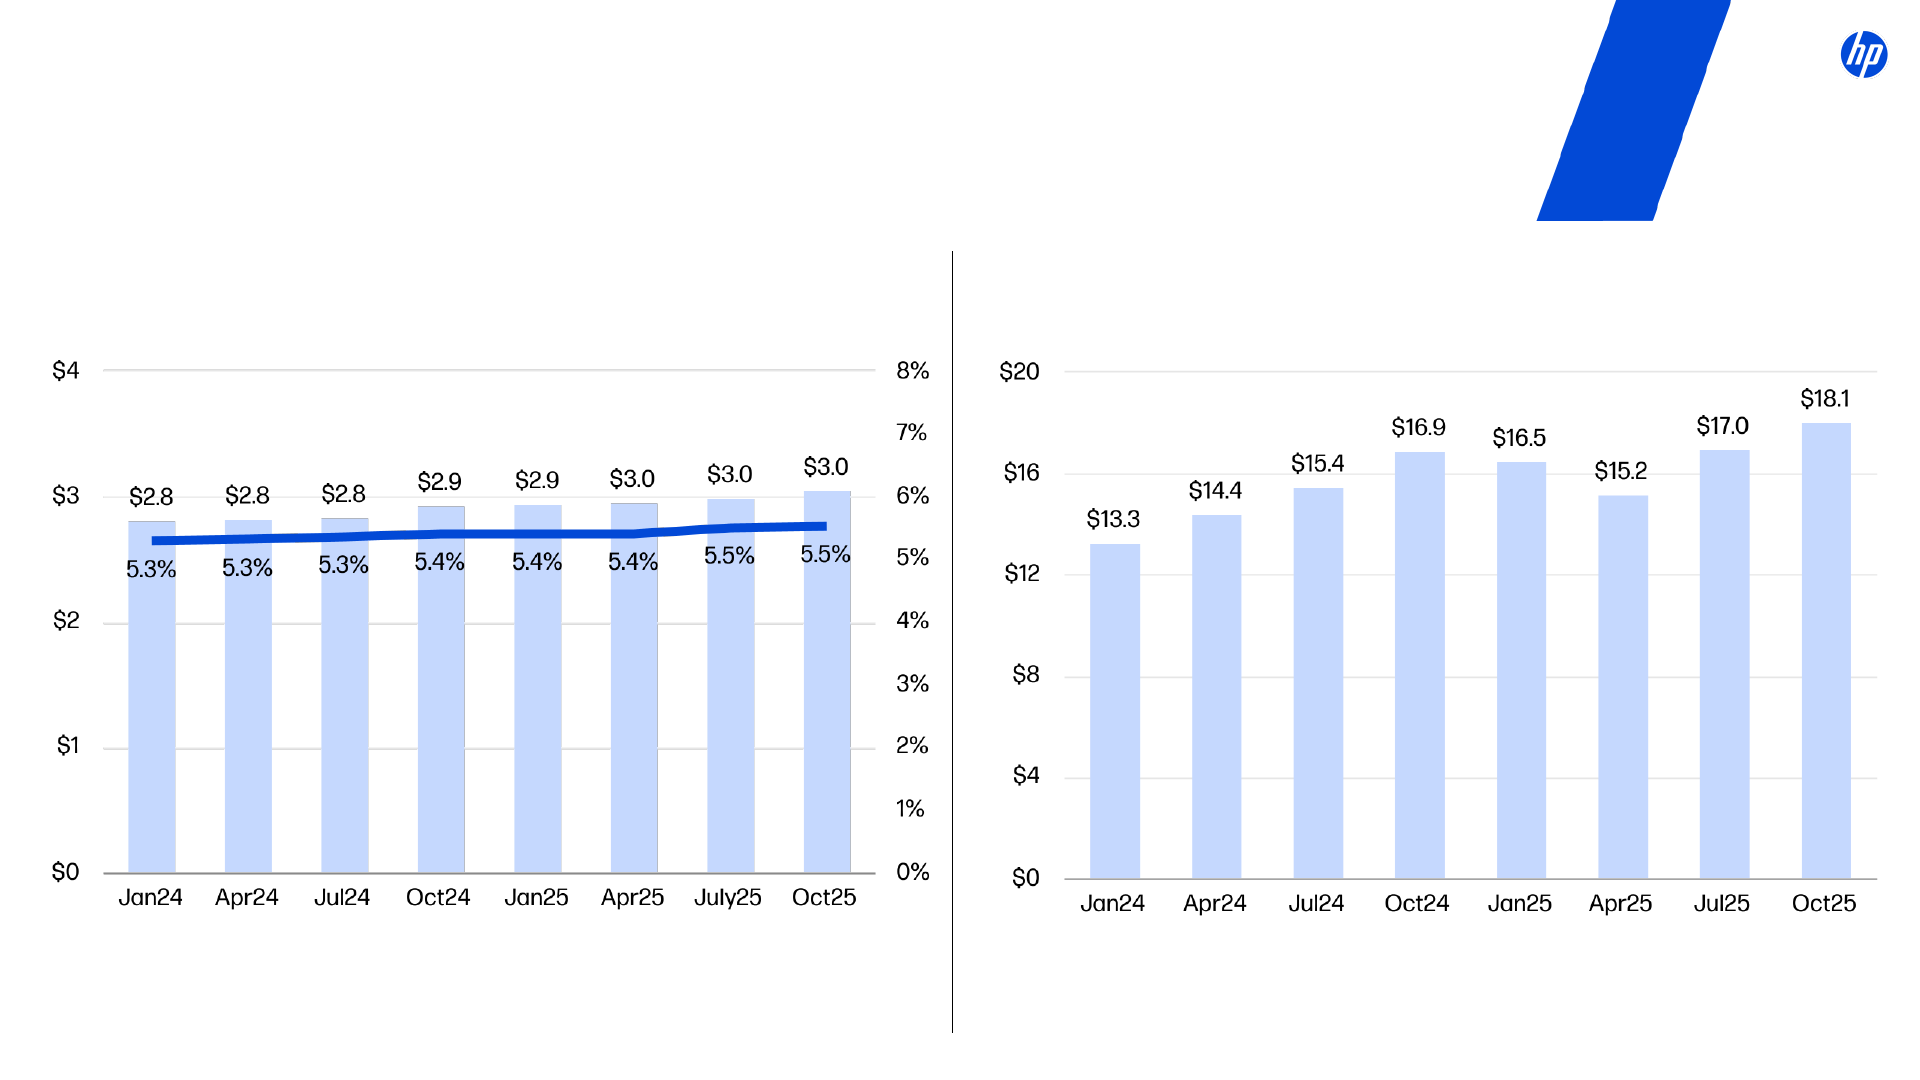
PP&E (In Billions / Percentage of Revenue¹)
| Period | $ Billions | % of Revenue |
|---|---|---|
| Jan24 | $2.8 | 5.3% |
| Apr24 | $2.8 | 5.3% |
| Jul24 | $2.8 | 5.3% |
| Oct24 | $2.9 | 5.4% |
| Jan25 | $2.9 | 5.4% |
| Apr25 | $3.0 | 5.4% |
| July25 | $3.0 | 5.5% |
| Oct25 | $3.0 | 5.5% |
Accounts Payable (In Billions)
| Period | $ Billions |
|---|---|
| Jan24 | $13.3 |
| Apr24 | $14.4 |
| Jul24 | $15.4 |
| Oct24 | $16.9 |
| Jan25 | $16.5 |
| Apr25 | $15.2 |
| Jul25 | $17.0 |
| Oct25 | $18.1 |
- % of revenue calculations based on trailing 4-quarter net revenue
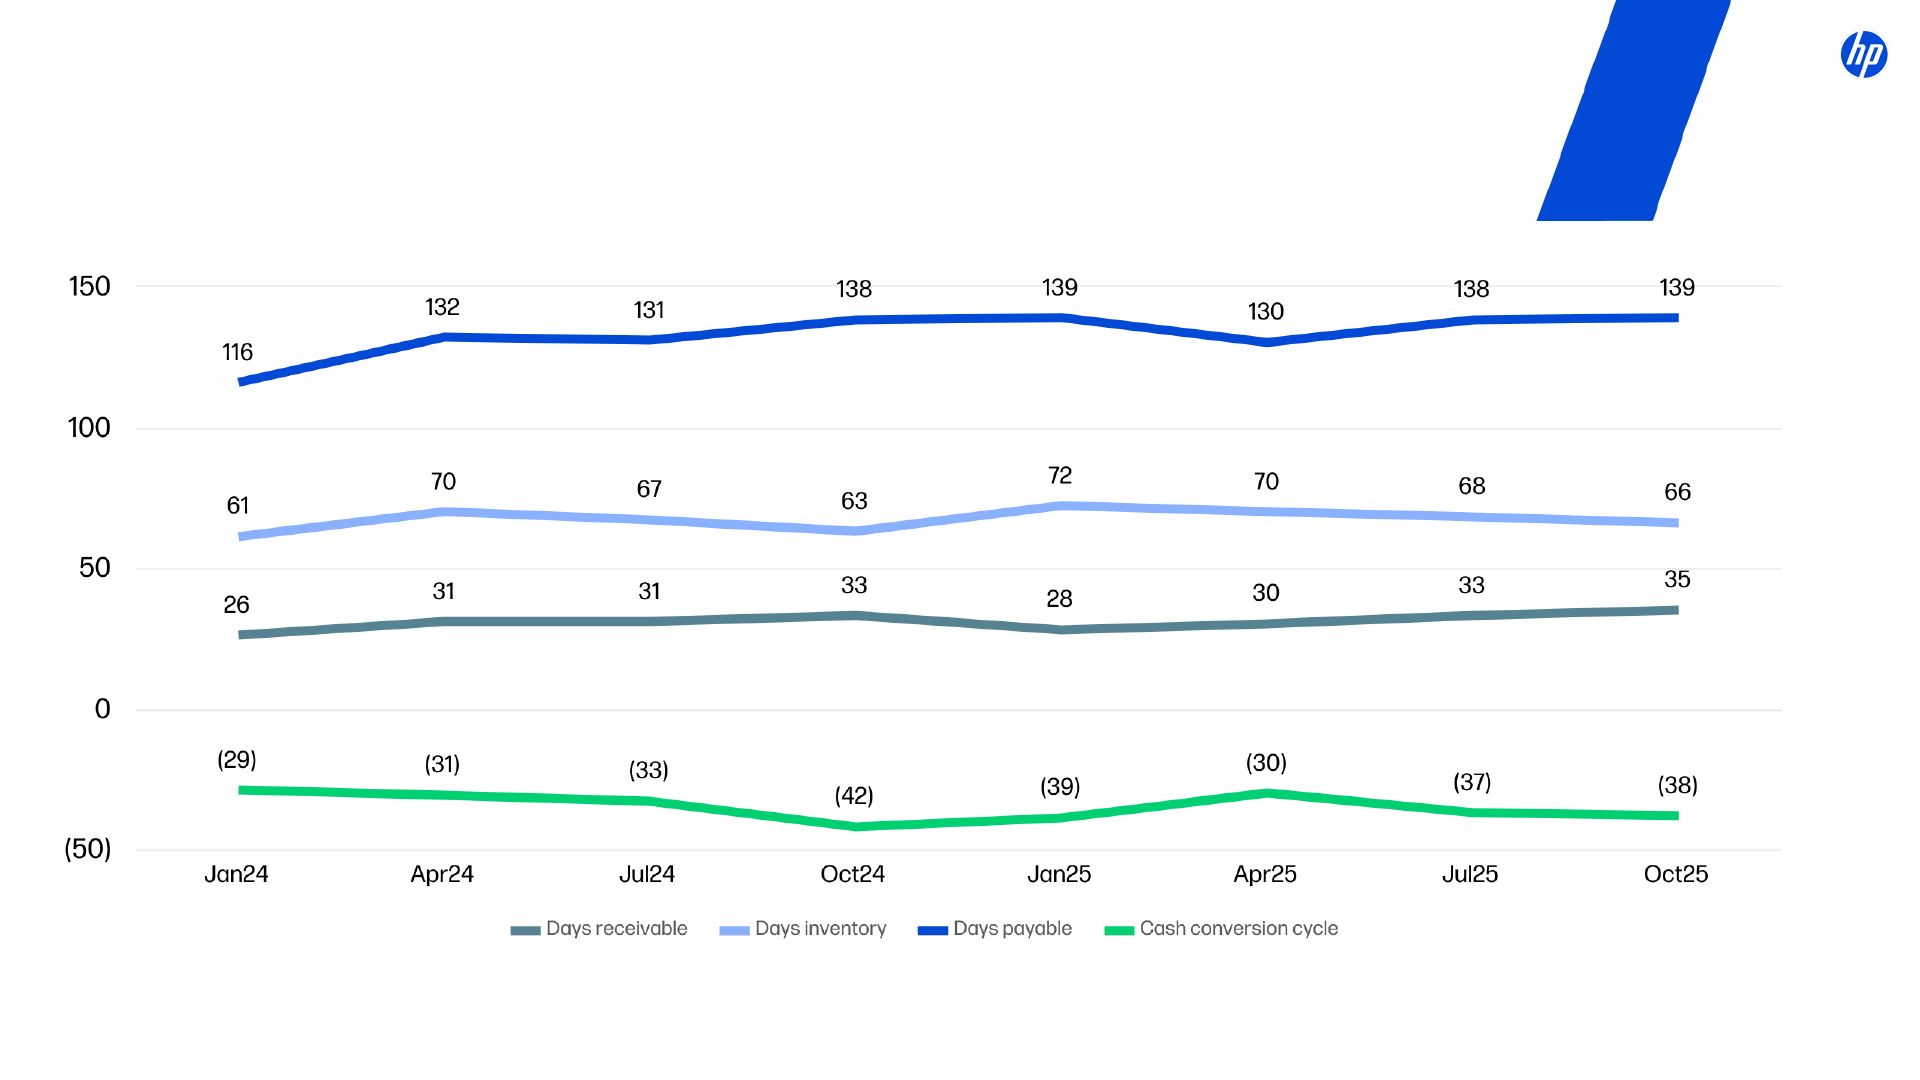
Working Capital Metrics
In Days
| Period | Days receivable | Days inventory | Days payable | Cash conversion cycle¹ |
|---|---|---|---|---|
| Jan24 | 26 | 61 | 116 | (29) |
| Apr24 | 31 | 70 | 132 | (31) |
| Jul24 | 31 | 67 | 131 | (33) |
| Oct24 | 33 | 63 | 138 | (42) |
| Jan25 | 28 | 72 | 139 | (39) |
| Apr25 | 30 | 70 | 130 | (30) |
| Jul25 | 33 | 68 | 138 | (37) |
| Oct25 | 35 | 66 | 139 | (38) |
- Cash conversion cycle = Days receivables + Days inventory – Days payable

Free Cash Flow Reconciliation
$ in millions
| 1Q24 | 2Q24 | 3Q24 | 4Q24 | FY24 | 1Q25 | 2Q25 | 3Q25 | 4Q25 | FY25 | |
|---|---|---|---|---|---|---|---|---|---|---|
| Net cash provided by operating activities | $121 | $581 | $1,424 | $1,623 | $3,749 | $374 | $38 | $1,661 | $1,624 | $3,697 |
| Net investment in property, plant, equipment and purchased intangibles | (158) | (119) | (162) | (153) | (592) | (302) | (183) | (215) | (197) | (897) |
| Net investment in leases from integrated financing | 62 | 19 | 42 | 42 | 165 | (2) | 50 | 23 | 60 | $131 |
| Free Cash Flow¹ | $25 | $481 | $1,304 | $1,512 | $3,322 | $70 | $(95) | $1,469 | $1,487 | $2,931 |
- A description of HP's use of non-GAAP information is provided on slide 3 under "Use of non-GAAP financial information"

Q3 FY25 GAAP to Non-GAAP Bridge
$ in millions, except tax rate and per share amounts
| GAAP | Amortization of intangible assets | Restructuring and other charges | Acquisition and divestiture charges | Certain litigation (benefits) charges, net | Non-operating retirement related (credits) / charges | Tax adjustments | Non-GAAP | |
|---|---|---|---|---|---|---|---|---|
| Revenue | $13,932 | $13,932 | ||||||
| Cost of revenue | 11,081 | 11,081 | ||||||
| Total OpEx | 2,135 | (159) | (110) | (8) | (2) | 1,856 | ||
| Operating profit | 716 | 159 | 110 | 8 | 2 | 995 | ||
| Interest and other, net | (92) | (52) | (2) | (146) | ||||
| Pre-tax earnings | 624 | 159 | 110 | 8 | (50) | (2) | 849 | |
| Income tax | 139 | (28) | (20) | (1) | 9 | 1 | (236) | (136) |
| Tax rate | 22.3% | 16.0% | ||||||
| Net earnings | $763 | 131 | 90 | 7 | (41) | (1) | (236) | $713 |
| Diluted net earnings per share | $0.80 | $0.14 | $0.09 | $0.00 | $(0.04) | $0.00 | $(0.24) | $0.75 |
A description of HP's use of non-GAAP information is provided on slide 3 under "Use of non-GAAP financial information"
Q2 FY25 GAAP to Non-GAAP Bridge
$ in millions, except tax rate and per share amounts
| GAAP | Amortization of intangible assets | Restructuring and other charges | Acquisition and divestiture charges | Certain litigation charges | Non-operating retirement related (credits) / charges | Tax adjustments | Non-GAAP | |
|---|---|---|---|---|---|---|---|---|
| Revenue | $13,220 | $13,220 | ||||||
| Cost of revenue | 10,481 | 10,481 | ||||||
| Total OpEx | 2,085 | (65) | (122) | (17) | (103) | 1,778 | ||
| Operating profit | 654 | 65 | 122 | 17 | 103 | 961 | ||
| Interest and other, net | (148) | (6) | (154) | |||||
| Pre-tax earnings | 506 | 65 | 122 | 17 | 103 | (6) | 807 | |
| Income tax | (100) | (12) | (24) | (2) | (19) | 2 | 26 | (129) |
| Tax rate | 19.8% | 16.0% | ||||||
| Net earnings | $406 | 53 | 98 | 15 | 84 | (4) | 26 | $678 |
| Diluted net earnings per share | $0.42 | $0.06 | $0.10 | $0.01 | $0.09 | $0.00 | $0.03 | $0.71 |
A description of HP's use of non-GAAP information is provided on slide 3 under "Use of non-GAAP financial information"
Q1 FY25 GAAP to Non-GAAP Bridge
$ in millions, except tax rate and per share amounts
| GAAP | Amortization of intangible assets | Restructuring and other charges | Acquisition and divestiture charges | Non-operating retirement related (credits) / charges | Tax adjustments | Non-GAAP | |
|---|---|---|---|---|---|---|---|
| Revenue | $13,504 | $13,504 | |||||
| Cost of revenue | 10,664 | 10,664 | |||||
| Total OpEx | 1,995 | (63) | (70) | (6) | 1,856 | ||
| Operating profit | 845 | 63 | 70 | 6 | 984 | ||
| Interest and other, net | (141) | (5) | (146) | ||||
| Pre-tax earnings | 704 | 63 | 70 | 6 | (5) | 838 | |
| Income tax | (139) | (11) | (14) | (1) | 2 | 29 | (134) |
| Tax rate | 19.7% | 16.0% | |||||
| Net earnings | $565 | 52 | 56 | 5 | (3) | 29 | $704 |
| Diluted net earnings per share | $0.59 | $0.05 | $0.06 | $0.00 | $0.00 | $0.04 | $0.74 |
A description of HP's use of non-GAAP information is provided on slide 3 under "Use of non-GAAP financial information"

FY24 GAAP to Non-GAAP Bridge
$ in millions, except tax rate and per share amounts
| A description of HP’s use of non-GAAP information is provided on slide 3 under “Use of non-GAAP financial information” | 34 |
|---|---|
| Q4 FY24 GAAP to Non-GAAP Bridge | |
| $ in millions, except | |
| tax rate and per | |
| share amounts GAAP | |
| Amortization | |
| of intangible | |
| assets | |
| Restructuring | |
| and other | |
| charges | |
| Acquisition and | |
| divestiture | |
| charges | |
| Certain | |
| litigation | |
| charges | |
| Debt | |
| extinguishment | |
| costs | |
| Non-operating | |
| retirement related | |
| (credits) / charges | |
| Tax | |
| adjustments Non-GAAP | |
| Revenue | $14,055 $14,055 |
| Cost of revenue | 11,054 11,054 |
| Total OpEx | 2,010 (76) (121) (12) (40) 1,761 |
| Operating profit | 991 76 121 12 40 1,240 |
| Interest and other, net | (129) 3 (2) (128) |
| Pre-tax earnings | 862 76 121 12 40 3 (2) 1,112 |
| Income tax | 44 (14) (24) (1) (8) 1 (176) (178) |
| Tax rate | (5.1)% 16.0% |
| Net earnings | $906 62 97 11 32 3 (1) (176) $934 |
| Diluted net earnings | |
| per share | |
| $0.93 $0.06 $0.10 $0.02 $0.03 $0.00 $0.00 $(0.18) $0.96 |
| A description of HP’s use of non-GAAP information is provided on slide 3 under “Use of non-GAAP financial information” | 35 |
|---|---|
| $ in millions, except | |
| tax rate and per | |
| share amounts GAAP | |
| Amortization | |
| of intangible assets | |
| Restructuring | |
| and other | |
| charges | |
| Acquisition and | |
| divestiture | |
| charges | |
| Certain litigation | |
| charges | |
| Non-operating | |
| retirement | |
| related (credits) / | |
| charges | |
| Tax | |
| adjustments Non-GAAP | |
| Revenue | $13,519 $13,519 |
| Cost of revenue | 10,613 10,613 |
| Total OpEx | 1,966 (81) (46) (22) (18) 1,799 |
| Operating profit | 940 81 46 22 18 1,107 |
| Interest and other, net | (113) (2) (115) |
| Pre-tax earnings | 827 81 46 22 18 (2) 992 |
| Income tax | (187) (14) (10) (2) (3) 2 56 (158) |
| Tax rate | 22.6% 16.0% |
| Net earnings | $640 67 36 20 15 56 $834 |
| Diluted net earnings | |
| per share | |
| $0.65 $0.07 $0.04 $0.01 $0.02 $0.00 $0.05 $0.84 | |
| Q3 FY24 GAAP to Non-GAAP Bridge |

36
Q2 FY24 GAAP to Non-GAAP Bridge
A description of HP’s use of non-GAAP information is provided on slide 3 under “Use of non-GAAP financial information”
$ in millions, except tax rate and per share amounts GAAP Amortization of intangible assets Restructuring and other charges Acquisition and divestiture charges Non-operating retirement related (credits) / charges Tax adjustments Non-GAAP
| Revenue | $12,800 $12,800 |
|---|---|
| Cost of revenue | 9,777 9,777 |
| Total OpEx | 2,071 (80) (71) (22) 1,898 |
| Operating profit | 952 80 71 22 1,125 |
| Interest and other, net | (155) (3) (158) |
| Pre-tax earnings | 797 80 71 22 (3) 967 |
| Income tax | (190) (15) (16) (3) 1 68 (155) |
| Tax rate | 23.8% 16.0% |
| Net earnings | $607 65 55 19 (2) 68 $812 |
| Diluted net earnings | |
| per share | |
| $0.61 $0.07 $0.06 $0.01 $0.00 $0.07 $0.82 |

37
Q1 FY24 GAAP to Non-GAAP Bridge
A description of HP’s use of non-GAAP information is provided on slide 3 under “Use of non-GAAP financial information”
$ in millions, except tax rate and per share amounts GAAP Amortization of intangible assets Restructuring and other charges Acquisition and divestiture charges Non-operating retirement related (credits) / charges Tax adjustments Non-GAAP
| Revenue | $13,185 $13,185 |
|---|---|
| Cost of revenue | 10,297 10,297 |
| Total OpEx | 1,953 (81) (63) (27) 1,782 |
| Operating profit | 935 81 63 27 1,106 |
| Interest and other, net | (142) (2) (144) |
| Pre-tax earnings | 793 81 63 27 (2) 962 |
| Income tax | (171) (15) (10) (5) 2 45 (154) |
| Tax rate | 21.6% 16.0% |
| Net earnings | $622 66 53 22 45 $808 |
| Diluted net earnings | |
| per share | |
| $0.62 $0.07 $0.05 $0.02 $0.00 $0.05 $0.81 |
38
FY23 GAAP to Non-GAAP Bridge
A description of HP’s use of non-GAAP information is provided on slide 3 under “Use of non-GAAP financial information”
$ in millions, except tax rate and per share amounts GAAP Amortization of intangible assets Restructuring and other charges Acquisition and divestiture charges Debt extinguishment benefit Non-operating retirement related (credits) / charges Tax adjustments Non-GAAP
| Revenue | $53,718 $53,718 |
|---|---|
| Cost of revenue | 42,210 42,210 |
| Total OpEx | 8,052 (350) (527) (240) 6,935 |
| Operating profit | 3,456 350 527 240 4,573 |
| Interest and other, net | (519) (107) (46) (672) |
| Pre-tax earnings | 2,937 350 527 240 (107) (46) 3,901 |
| Income tax | 326 (66) (101) (42) 25 12 (778) (624) |
| Tax rate | (11.1)% 16.0% |
| Net earnings | $3,263 284 426 198 (82) (34) (778) $3,277 |
| Diluted net earnings | |
| per share | |
| $3.26 $0.28 $0.42 $0.20 $(0.08) $(0.03) $(0.77) $3.28 |
| A description of HP’s use of non-GAAP information is provided on slide 3 under “Use of non-GAAP financial information” | 39 |
|---|---|
| $ in millions, except | |
| tax rate and per | |
| share amounts GAAP | |
| Amortization | |
| of intangible assets | |
| Restructuring | |
| and other | |
| charges | |
| Acquisition and | |
| divestiture | |
| charges | |
| Non-operating | |
| retirement related | |
| (credits) / charges | |
| Tax | |
| adjustments Non-GAAP | |
| Revenue | $13,817 $13,817 |
| Cost of revenue | 10,832 10,832 |
| Total OpEx | 1,971 (88) (111) (34) 1,738 |
| Operating profit | 1,014 88 111 34 1,247 |
| Interest and other, net | (162) (11) (173) |
| Pre-tax earnings | 852 88 111 34 (11) 1,074 |
| Income tax | 122 (16) (19) (6) 3 (256) (172) |
| Tax rate | (14.3)% 16.0% |
| Net earnings | $974 72 92 28 (8) (256) $902 |
| Diluted net earnings | |
| per share | |
| $0.97 $0.07 $0.09 $0.03 $(0.01) $(0.25) $0.90 | |
| Q4 FY23 GAAP to Non-GAAP Bridge |